Tag Archives: Obiee
Real World OBIEE: Demystification of Variables Pt. 3

In part two of this blog series, I went over using Repository, System and Presentation Variables to make reports dynamic for any series of time. In part three, I am going to talk about making reports dynamic for periods of time using built in functions within Answers itself.
Real World
While it's a lot more efficient to create Repository Variables to use in filters and prompts for time dimensions, sometimes it is simply not possible. Perhaps you are a front end developer for OBIEE and have no access to the RPD or the database . Perhaps you have no communication with the person in your organization who handles all of the RPD development and therefore can not submit any change requests.
Don't worry. We've got you covered.
There are several functions and tricks you can use within Answers itself to make reports dynamic and eliminate having to hardcode dates.
The Scenario
I am going to use the same scenario I used for part two of this series for the example one. To recap, here are the requirements:
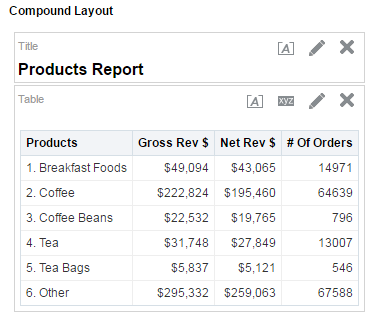
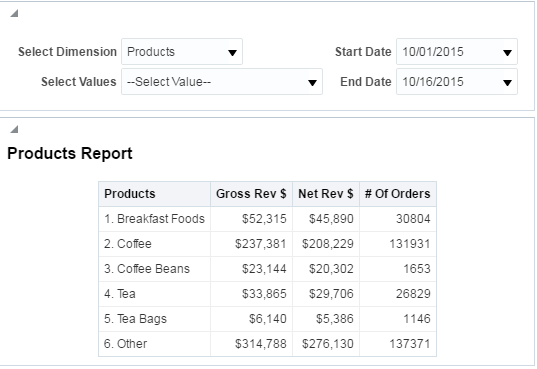
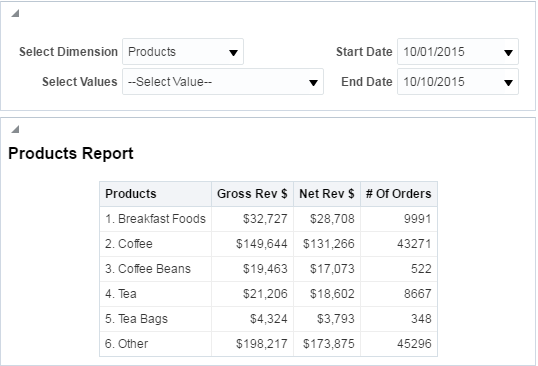
I have been asked to create a report that is going to reside on a products dashboard. It needs to have the same product grouping as the report I used in part one of this series, needs to contain 'Gross Rev $', 'Net Rev $' and '# of Orders' and have a prompt that can select between the first and current day of the month and every day in-between. The person who requested the report wants the prompt to change dynamically with each month and does not want users to be able to select future dates.
In part two, I used a custom SQL statment which used Repository Variables I created to populate all the date values from the first of every month to the current date for Variable Prompts. There is a gap in the data loads for # of Orders in which data does not update until the 2nd or 3rd of each new month. The person who requested the report wanted a summary of the previous months '# of Orders' to be shown until the data is updated for the current month. I used a Repository Variable that returned the value of the previous month with the current year and used a CASE statement with along with Filter Expressions to switch between the Filter Expression using the Repository Variable (Prev_Month) if the date was <=2 or if # of Orders is null and the Filter Expression which contained the Start Date and End_Date Presentation Variable placeholders which were defined in my Variable Prompts.
Example One
In this example, I have to figure out a way to make the report dynamic with only the functions available within Answers. There are two parts to this example. First I need to use a function that will return the previous month's value for the Calendar Year Month column to use with the '# of Orders' column. This will replace the Repository Variable Prev_Month I used in part two of this series. Second I need to write a new SQL statment for the Start Date and End_Date prompts I created in part two and also define a new SQL statment for the default values in those prompts.
Part 1
I am going to start by creating a new statement to return the previous month's value for the Calendar Year Month column. I can use the TIMESTAMPADD function in conjunction with the extraction syntax 'YEAR' and 'MONTH' to return the desired results. Let's take a look at the entire statment and then I will break it down.
CAST(YEAR(timestampadd(SQL_TSI_YEAR, -1,CURRENT_DATE))*100+MONTH(timestampadd(SQL_TSI_MONTH, -1,CURRENT_DATE)) AS VARCHAR(6))1. TIMESTAMPADD - This is what defines that I am going to use addition to return a date by adding or one date to another.
2. SQL_TSI_YEAR and SQL_TSI_MONTH - The first argument in the function. It defines what interval of time the function will work with.
3. -1. This the interval of time that is compared to the third argument.
4. CURRENT_DATE - The third argument in the function. This is what the second argument is compared against.
5. YEAR and MONTH - This is the extraction syntax that will return only the year and the month respectively.
Also notice that I have used VARCHAR(6) for the CAST argument. If I use VARCHAR, I can specify the exact number of characters I want returned.
Now I need to copy my column formula and paste it into the column formula that I created for '# of Orders' in part two of this series.
I am going to replace the Prev_Month Repository Variable with my statement, which will look like this.
CASE WHEN DAY(CURRENT_DATE)<=2 or="" "sales="" -="" fact="" sales"."measures"."#="" of="" orders"="" is="" null="" then="" filter("sales="" using="" ("sales="" sales"."periods"."calendar="" year="" month"="CAST(YEAR(timestampadd(SQL_TSI_MONTH," -1,current_date))*100+month(timestampadd(sql_tsi_month,="" -1,current_date))="" as="" varchar(6))))="" else="" ("periods"."day="" date"="" between="" @{pv_start_dt}{date="" '2015-10-01'}="" and="" @{pv_end_dt}{date="" '2015-10-15'}))="" end<="" code="">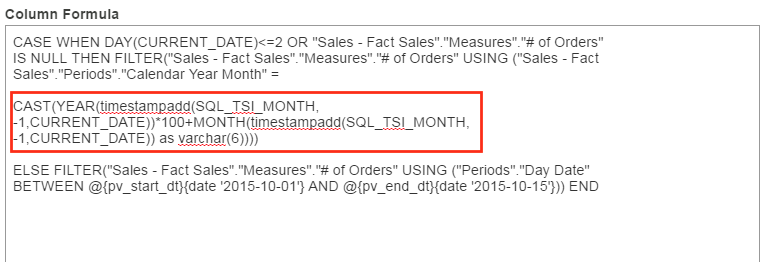
If I run the report, my results return as expected.
Part 2
Now I need to write a new SQL statement for my Start Date and End Date prompts. In order to do this, I am going to need to use two functions: TIMESTAMPS and CURRENT_DATE. First, lets take a look at the TIMESTAMP function.
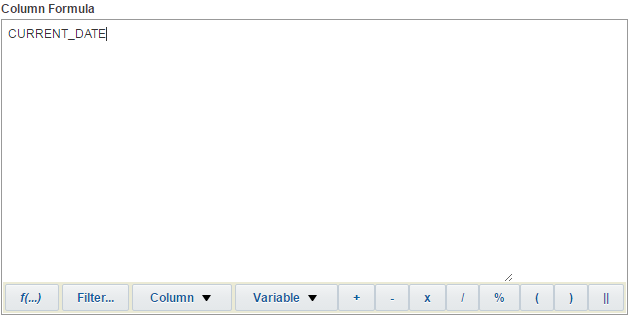
I am going to use the TIMESTAMP function to filter the Day Date column for the first day of the month. To demonstrate, I am going to create a new analysis and use the TIMESTAMP function in a column formula. My column formula looks like the following:
TIMESTAMPADD(SQL_TSI_DAY, -DAYOFMONTH(CURRENT_DATE) +1, CURRENT_DATE)This formula can be broken down into four parts:
1. TIMESTAMPADD - This is what defines that I am going to use addition to return a date by adding or one date to another.
2. SQL_TSI_DAY - The first argument in the function. It defines what interval of time the function will work with (in this case days)
3. -DAYOFMONTH(CURRENT_DATE)+1 - This the interval of time that is compared to the third argument. In this case I am taking the negative value of the day of the month, adding 1 and then adding it with current date which always returns 1 or the first day of the month.
4. CURRENT_DATE - The third argument in the function. This is what the second argument is compared against.
This is only scratching the surface of what you can do with the TIMESTAMP function. If you would like more information, check out the blog on TIMESTAMPS written by Brian Hall.
I am going to add an additional column to the Criteria and use the CURRENT_DATE function in a column formula.
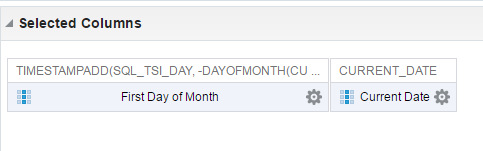
Now I am going to click on Results to show the results of the TIMESTAMP function and the CURRRENT_DATE function.
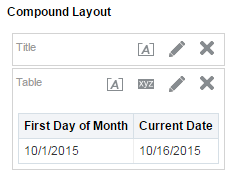
From the results you can see that I have both the first day of the month and the current date. Now I need to convert this into a filter for the Day Date column so that I can get the logical SQL query for my Start Date and End Date prompts.
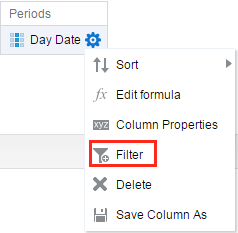
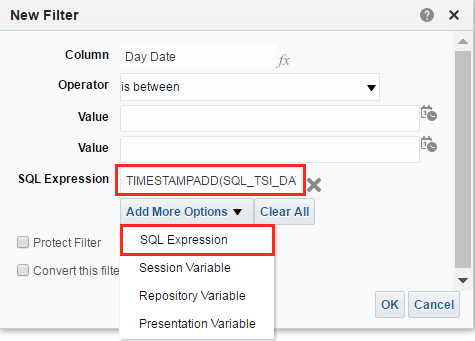
In the New Filter window, I need to change the operator to is between and click on Add More Options to add a SQL Expression.
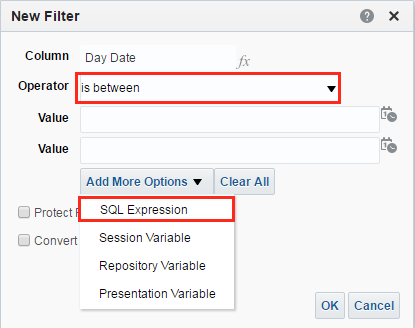
In the SQL Expression box, I need to put the TIMESTAMP function for current date from the previous example. In addition I need to add another SQL Expression for the CURRENT_DATE function.
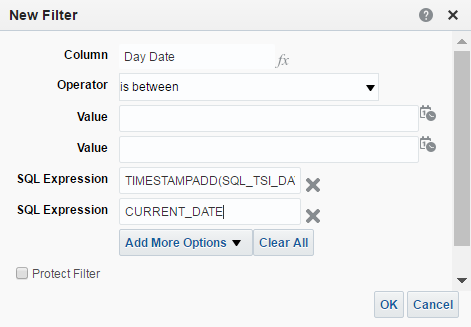
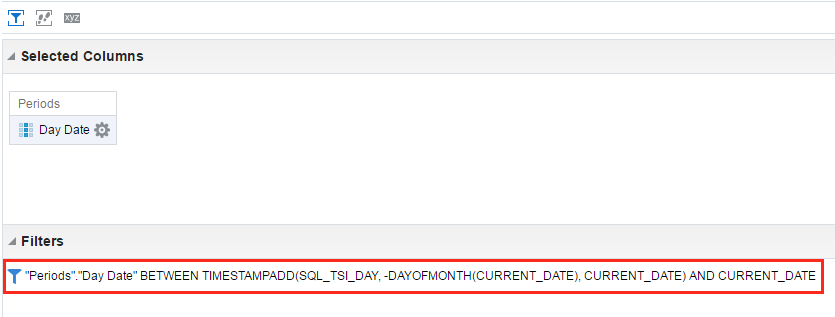
When I return to my Criteria, I can see the filter I created in the Filter window.
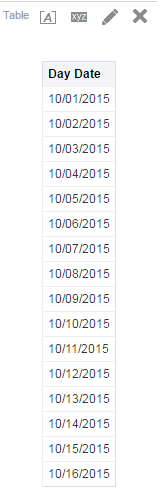
I can click on Results to run the report. The results for the Day Date column return as expected.
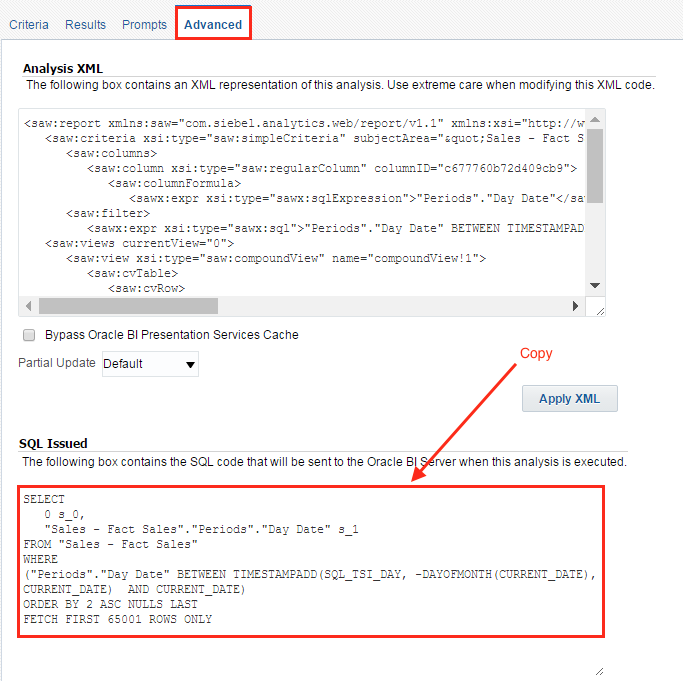
Now I can click on the Advanced tab and copy the logical SQL statement to use for my Start Date and End Date prompts.
Now I am going to paste the following into my Start Date Variable Prompt
Choice List Values > SQL Results
SELECT "Sales - Fact Sales"."Periods"."Day Date"
FROM "Sales - Fact Sales" WHERE ("Periods"."Day Date" BETWEEN TIMESTAMPADD(SQL_TSI_DAY, -DAYOFMONTH(CURRENT_DATE), CURRENT_DATE)  AND CURRENT_DATE)
ORDER BY "Periods"."Day Date"
Default Selection > SQL Results
SELECT
TIMESTAMPADD(SQL_TSI_DAY, -DAYOFMONTH(CURRENT_DATE) +1, CURRENT_DATE)
FROM "Sales - Fact Sales"
FETCH FIRST 65001 ROWS ONLY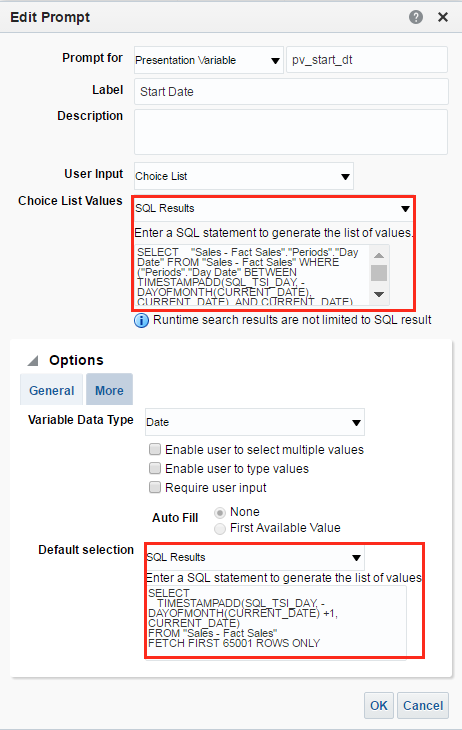
For the default selection, I am using a SQL statment that is selecting the first day of the month using the same TIMESTAMP function used in the above query from my subject area "Sales - Fact Sales".
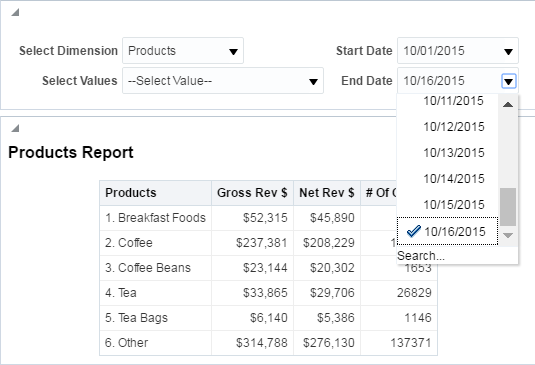
Now I need to change the SQL query for both the Choice List Values and Default Selection for my End Date Variable Prompt.
I am going to use the same SQL query for the Choice List Values in my End Date prompt as I did in my Start Date prompt. I am going to change the default selection to the following:
SELECT
CURRENT_DATE
FROM "Sales - Fact Sales"
FETCH FIRST 65001 ROWS ONLY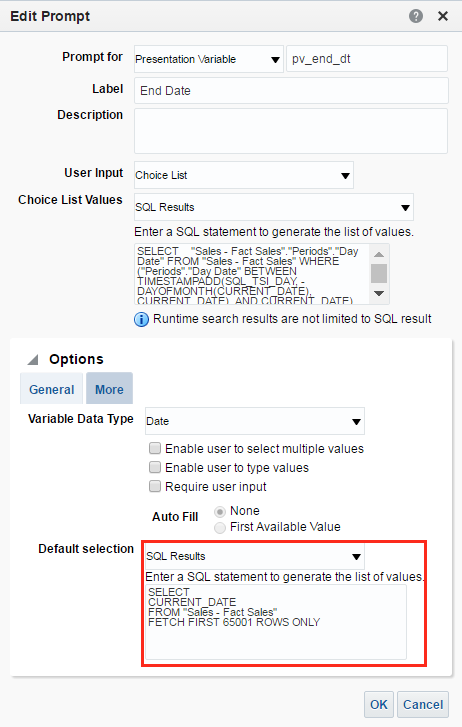
If I go to the Display window, I can view the results of my changes.
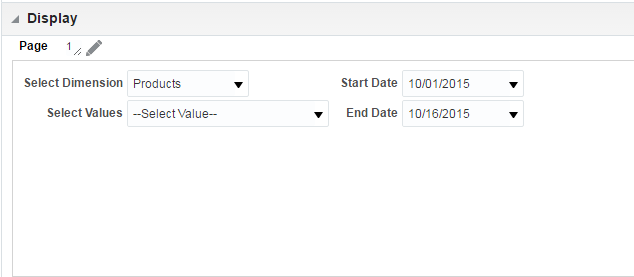
Notice that the results are exactly the same as the results in part two of this series.
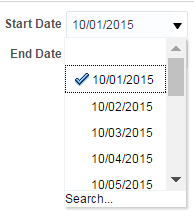
I can save the dashboard prompt and go to my dashboard and test the prompt.
In Conclusion
In part one of this series, we looked at using Bins, CASE statements to create custom grouping for values and switch between those groups and values using Presentation Variables.
In part two of this series, we looked at creating Repository Variables to make reports dynamic using those Repository Variables in Variable Prompts and passing them into column formulas using Presentation Variables.
In the third and final part of this series, we looked at making reports dynamic by using built in functions within Answers such as TIMESTAMPS and CURRENT_DATE.
My hope is that you can take these examples and apply them in your own OBIEE development. If you would like to know more about front end or RPD development, please check out the variety of training courses we offer at Rittman Mead. Until next time.
Knowledge Article: OBIEE 12c: Troubleshooting Crash Issues
|
|||
|
|||
|
This troubleshooting document will guide you through a series of steps to assist in investigating a crash in an OBIEE 12c environment.
Have a question or an issue that you can not identify - why not speak to the Oracle Business Intelligence Enterprise Edition Community as a first step on your way to a solution? My Oracle Support Community (MOSC)
|

OBIEE 12c: Troubleshooting Stuck Threads or Hangs
|
|||
|
|||
|
This article provides troubleshooting steps and methods to assist with troubleshooting "stuck thread" issues in an OBIEE 12c installation.
Have a question or an issue that you can not identify - why not speak to the Oracle Business Intelligence Enterprise Edition Community as a first step on your way to a solution? My Oracle Support Community (MOSC)
|
A Performance Analytics Application Case Study: Challenges and Successes
The Performance Analytics application is a collection of open source technologies that aids users in: identifying performance bottlenecks, identifying causes for slow report execution, discovering areas for performance optimization, and gathering meaningful insights into the health of an OBIEE environment.
This post focuses on lessons learned after a successful Performance Analytics application installation, where within one day of being operational it enabled us to identify and isolate a long-standing memory issue. Here's how.
Overview
Rittman Mead recently undertook an engagement with the remit to:
- Carry out a health check on the current state of an OBIEE platform, architecture, and development process
- Install the Rittman Mead Performance Analytics application, enabling rapid and accurate diagnostics of OBIEE issues
The client was on OBIEE 11g, having previously upgraded from 10g. OBIEE Production environment was a three-node cluster running the latest version of the 11g release. It served around 150 users daily, of a registered user base of around 1000.
The client had a long-standing issue with memory alerts on the master node of OBIEE cluster, but no evident architectural, hardware capacity, or software configuration issues were found after completing the health check.
Challenges and successes
Gather all relevant data
Performance Analytics gathers data from a variety of sources in order to provide a full stack view of the OBIEE environment.
Active Session History (ASH) - The Active Session History data is read from the v$ACTIVE_SESSION_HISTORY system database view. Access to this data allows Performance Analytics users to have an understanding of the performance and state of the database at a given point it time as it provides information such as the SQL operation being performed, which application is executing the query, whether the query is actively being performed or is waiting for service, what state of execution the query is in, and many other useful statistics.
Operating System Metrics - Unix-based Operating Systems contain several commands used to gather information about the performance or status of the server such as vmstat, iostat, netstat, top and df. Performance Analytics utilizes the output of these commands to display the current status of the OS at a given point in time.
Usage Tracking - The Oracle BI Server supports the collection of usage tracking data. When usage tracking is enabled, the Oracle BI Server collects usage tracking data for each query, and it writes statistics to a usage tracking log file or inserts them directly into a database table. Access to this data allows Performance Analytics users to have an understanding of the performance of the BI Server and specific reports in the OBIEE environment at any given point in time.
OBIEE metrics - OBIEE has the capability to expose internal performance data through the Dynamic Monitoring Service (DMS). The data exposed contains information such as Connection Pool statistics, JVM statistics, the number of active threads, and much more. Access to this data allows Performance Analytics to record the current status of many of the OBIEE components and intricacies found within the tool.
Performance Analytics was deployed using Docker in a couple of days, requiring absolutely no software installation on any machine other than the monitoring server. All configuration settings are held in one file, and it was sufficient to add connection details of each server to it in order to gather all aforementioned data.
Accurately diagnose issues
By combining operating system metrics (CPU, memory, etc.) with internal OBIEE metrics and those from the database, Performance Analytics gives a "single pane of glass" view on the behaviour of the whole stack. This enables correlations in behaviour to be easily identified, and issues drilled into using the analysis capabilities of the tool.
Within a day of being installed, Performance Analytics enabled the client to accurately diagnose a long-standing issue with memory alerts on OBIEE master node. The cause was traced to the export to Excel of a large dataset by a single user.
Workload Planning
Performance Analytics allows to capture system status and workload over time, so you can see how the system is responding to peak loads in real-time.
With Performance Analytics the client is now able to estimate maximum workload the current architecture can support before starting to see issues and whether it is going to cope with the next years workload.
Conclusion
Performance Analytics just paid for itself.
Performance Analytics collects all relevant data and makes it accessible from one central location, allowing users to investigate performance inquiries promptly and simply. Instead of forcing users to dig through database records or a linux server manually, they can access all of the same data through a set of dashboards engineered to facilitate discovery from the collected data.
If you’d like to find out more about the Performance Analytics service offered by Rittman Mead, please get in touch.
A Case for Essbase and Oracle Data Visualization
So it’s the end of the month, or maybe even the end of the quarter. And you’ve found yourself faced, yet again, with the task of pulling whatever data will be needed to produce the usual standardized budgetary and / or finance reports. You’re dreading this as it will probably eat up most of your day just getting the data you need, combing through it to find the metrics you need, and plugging them into your monumentally complicated custom spreadsheet, only to find the numbers are, well, off.

Enter Data Visualization (DV), and its lightweight brother application, Data Visualization Desktop (DVD). My bud at RM, Matt Walding, already did a pretty great post on some of the cursory features of DVD, covering a lot of the important how-tos and what’s whats. So check that out if you need a bit of a walkthrough. Both of these great tools tout that you can go from zero to analysis pretty darn quick, and from the extensive testing and prodding we’ve done with both DV and DVD, this claim is accurate. Now how does this help us, however, in the previous scenario? Well, IT processes being what they are in a lot of mid to large size companies, getting the data we need, to do the crunching we need to do, can be quite the monumental task, let alone the correct data. So when we get it, we are going to want a solution that can take us from zero to report, pretty darn quick.
If you’re the one stuck with doing the crunching, and then providing the subsequent results, your solution or workflow probably resembles one of the following:
Scenario 1

Emailed a spreadsheet with a ton of rows. Download the csv/xlsx and then crunch the rows into something that you can force into a super spreadsheet that has a ton of moving pieces just waiting to throw an error.
Scenario 2

You have access to Essbase, which stays pretty fresh, especially as reporting time draws nigh. You connect to Smartview and extract what you need for your report. See scenario 1.
Scenario 3

You have OBIEE that you depend on for data dumps, and then just export whatever you need. See scenario 1.
While there are no doubt variations on these themes, the bigger picture here is that between the time you receive your dataset and the final report, there are likely a few iterations of said final report. Maybe you’re having to make corrections to your Excel templates, perhaps the numbers on your sheet just aren’t jiving. Whatever the case may be, this part of the process is often the one that can be the most demanding of your time, not to mention the most headache inducing. So what’s the point of my schpeal? Well, wouldn’t it be nice to expedite this part of the whole thing? Let’s take a look at how we can do just that with both Data Visualization in OBIEE and Data Visualization Desktop.
Data Visualization
With DV, we can simply access any of our existing OBIEE subject areas to quickly create a basic pivot table. Right away you can see the profound time savings garnered by using DV. What's more, you don't need to feel forced into managing OBIEE on premises, as DV is also part of BICS (Business Intelligence Cloud Service) and DVCS (Data Visualization Cloud Service).

Even if you have Smartview, and can do more or less the same thing, what if you wanted to delegate some of the tedium involved in manually crunching all those rows? You could simply hand off an export to another analyst, and have them plug it right into their own instance of Data Visualization Desktop, which, might I add, comes with your purchase of the DV license. This also, however, leads down the slippery slope into siloing off your department. This approach is essentially doing that, however kept under the quarantine that is DVD, as this blog is touting, and keeping the data with which you are working consistent, you shouldn't be able to do too much damage. The point I'm trying to make is that everything about using DV and DVD as your sort of report crafting and proofing mediums, is super-fluid and smooth. The process from source system to report and over and over again, is super-seamless. Even if I didn't have direct access to the data source I needed, and had to rely on emailed data dumps or other, I can simply upload that sheet right into DV, assign some data types, and get to work. I can even add dynamic filters to the analysis by simply dragging and dropping a column to the filters area. If you're feeling adventurous, you could also display these tables on a dashboard, that perhaps your department looks at to proof them and share in the pleasurable experience that is concocting period-end reporting.

![]()

Data Visualization Desktop
Right now, DVD is only out for Windows (with a version for the Mac on the roadmap), which is mostly ok, as most every medium to large size company I have worked with employs Windows as their go-to OS. An analyst can install the program on their desktop machine and be ready to plug away in under 10 minutes. We can take the example spreadsheet above that we dumped out of VA and create our own version of the report right in DVD. One better, we can also blend it with any other source DVD can connect to. This feature, especially, can save lots of time when trying to get your numbers just right for sign off.
Looks Just Like DV

Acts Just Like DV


And hold the phone! There's even a native Essbase connector!


Actually One Better Than DV!
Speaking of connectors, check out the rest of the list, as well as the custom data flow functionality, which allows you to construct and save in-app data transformations to be invoked again, and again, and again...

Summary
Flexibility is the name of the game with DV and DVD. So sure, while it isn't the ideal tool for creating precisely formatted financial statements for SEC submission, it sure beats massaging and munging all that data in Excel. And once we're happy with our numbers, either by sharing our reports on a dashboard, or export, we can go ahead and plug our numbers right into whatever tool we are going to use to produce the final product. We've covered a couple of really good concepts, so let's just do a bit of a wrap up to make everything a bit more cohesive.
We can pull data into Data Visualization from OBIEE, from a spreadsheet, or even mash up the two to handle any inconsistencies that may exist at month's/quarter's end. Note that we can also use Smartview to pull directly to Excel. Note that you will be unable to use the OLAP capabilities of Essbase / Essbase in OBIEE, as the data will presented in DV and DVD as flattened hierarchies.
We can share reports in Data Visualization with other analysts or approvers via a dashboard (note that this is not a supported feature, but something that requires only a 'bit' of a hack) or PDF, or hand off our exported data set for further work. This can be to another person using DV or DVD.
Data Visualization Desktop can connect directly to our Essbase source or utilize a data dump from DV / OBIEE to do further work and analysis on the data set. We can also connect DVD to OBIEE, as posted here, in order to extract an analysis from the web catalog. This will at least save us the step of dumping / emailing the report.
All of this app-to-app compatability encourages a sustainable, functional, and fluid reporting environment (warning: data silos!), especially for those who are unfamiliar with the ins and outs of Essbase and / or working with OBIEE.

