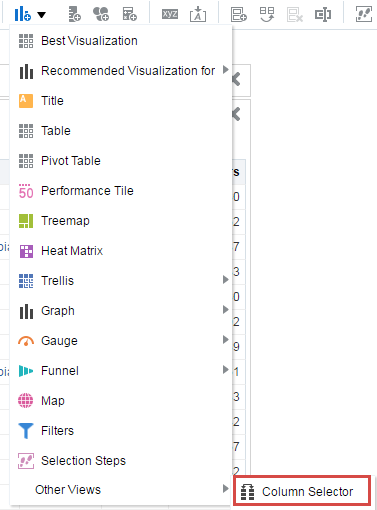
Tag Archives: VARIABLES
Timestamp Functions and Presentation Variables in Oracle Cloud Analytics
One of the most popular Rittman Mead blog posts over the last 10 years is Timestamps and Presentation Variables. As we are seeing more and more migrations to OAC, we decided to review and revise this post for the latest version of Oracle Cloud Analytics (OAC), 105.4.0-140 as of October 2019. Read more about the latest updates here.
--
One could say that creating a chart is not the most complex task in the world of Business Intelligence but we would argue that creating a meaningful report that perfectly illustrates the message hidden in data and therefore adds value to the management is nowhere close to being easy! A good way to make a report as informative as possible is to use trends and comparison. And to do so, a perfect tool would be the time analysis functions. For example comparing sales in a period of time this year to the same period of time the year before. Or measure the similarity or dissimilarity of sales in different months of the year.
Demo Platform
I have used a free trial instance of OAC for this demo. If you haven’t done yet, sign up for a free 30-day trial Oracle Cloud account (different to an Oracle account). Use the account to access the Oracle Cloud Infrastructure (OCI) console which is the latest Oracle movement towards having one integrated cloud platform to manage all your Oracle cloud applications, platforms, and infrastructure in one place.
From the OCI console it is 5 to 10 minutes before your free trial instance of OAC is up and running. For the detailed step by step of creating a new instance read here.
Demo Goals
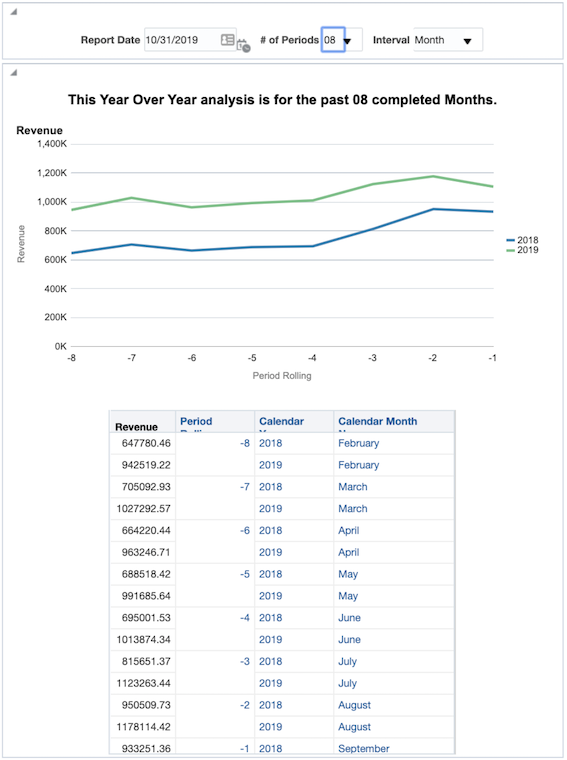
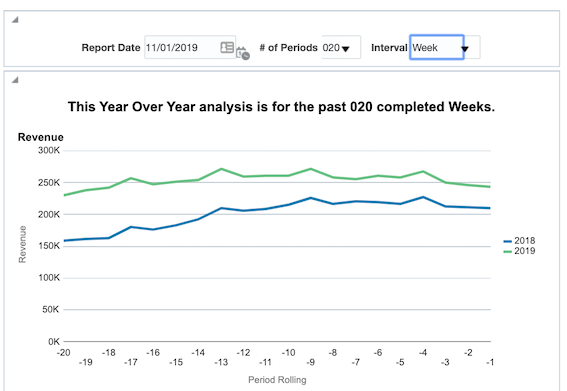
In this blog post I intend to show you how to combine the power of timestamp functions and presentation variables to create robust, repeatable reports. We will create a report that displays a year over year analysis for any rolling number of periods, by week or month, from any date in time, all determined by the user. This entire demo will only use values from a date and a revenue field.
TIMESTAMP Functions
TIMESTAMPADD() manipulates data of the data types DATE and DATETIME based on a calendar year.
Syntax: TIMESTAMPADD(interval, expr, timestamp)
Example: TIMESTAMPADD(SQL_TSI_MONTH, 12,Time."Order Date")
Description: Adds a specified number of intervals to a timestamp, and returns a single timestamp.
Timestamp Interval (TSI) Options: SQL_TSI_SECOND, SQL_TSI_MINUTE, SQL_TSI_HOUR, SQL_TSI_DAY, SQL_TSI_WEEK, SQL_TSI_MONTH, SQL_TSI_QUARTER, SQL_TSI_YEAR
Read more about other calendar functions.
Building Filters
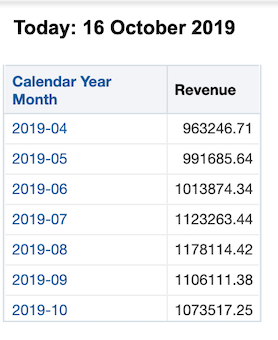
Starting to build our demo, the filter below returns all dates greater than or equal to 7 days ago including the current date.

In other words we have now a functional filter to select all the rows where Date >= a week ago.
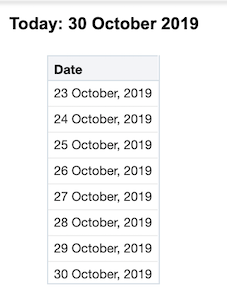
As a good practice, always include a second filter giving an upper limit to the time filter. For example "Periods"."Day Date" < CURRENT_DATE would confirm that there won’t be any records that you don’t want in the mix and therefore no unnecessary strain on the system.
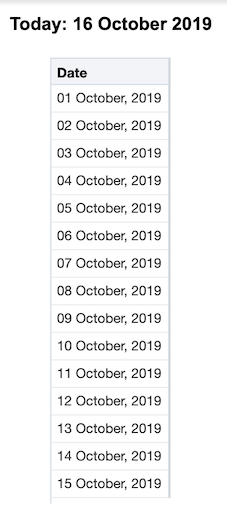
Let’s go one step further, instead of going 7 days back, we could try and include all the previous days in the current month or in other words dates >= the first day of the month. In this scenario, we can use the DAYOFMONTH() function to get the calendar day of any date. From here it will be easy to calculate the number of days in the month so far. Our new filter would look like this:
For example, if today is October 16th, DAYOFMONTH(CURRENT_DATE) would equal 16. Thus, we would subtract 16 days from CURRENT_DATE to go back to September 30th, and adding one will give us October 1st.
Presentation Variables
A presentation variable is a variable that can be created from the front end, the Analytics as part of one of the following types of dashboard prompts:
- Column prompt, Associated with a column and the values that it can take come from the column values. For information on working with column prompts, see Creating a Column Prompt.
- Variable prompt, Not associated with any column, and you define the values that it can take. For information on working with variable prompts, see Creating a Variable Prompt.
Each time a user selects a value in the column or variable prompt, the value of the presentation variable is set to the value that the user selects and will then be sent to any references of that filter throughout the dashboard page. This could be filters, formulas and even text boxes.
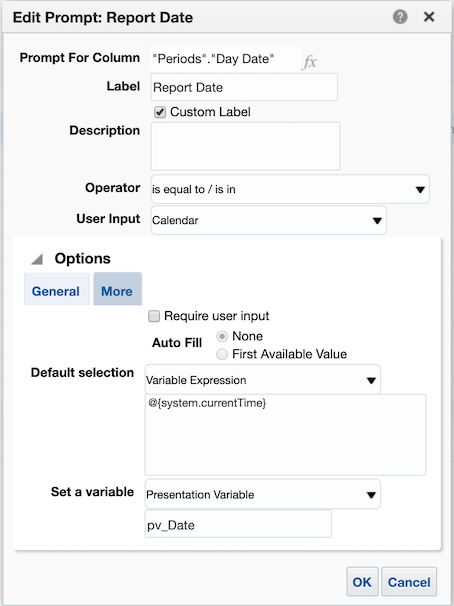
The first presentation variable we could introduce is to replace the CURRENT_DATE with a prompted value. Let’s call this presentation variable pv_Date,
- Use the syntax
@{pv_Date}to call this variable in the reports. - For variables of type string, surround the name in single quotes:
‘@{pv_String]’ - It is good practice to assign a default value to the presentation variables so that you can work with your report before publishing it to a dashboard. For example the default value for the
pv_DateisCURRENT_DATEso the new syntax would be@{pv_Date}{CURRENT_DATE}
Demo Time!
Our updated filter after replacing the CURRENT_DATE looks like below. Will will refer to this filter later as Filter 1 (F1).

The filter is starting to take shape. Now let's say we are going to always be looking at a date range of six months before the selected date. All we would need to do is create a nested TIMESTAMP function. To do this, we will “wrap” our current TIMESTAMP with another that will subtract six months:

Now we have a filter to select dates that are greater than or equal to the first day of the month of any given date and all the six months prior to that.
To take this one step further, we can create another presentation variable called pv_n to allow the users to determine the amount of months to include in this analysis from a dashboard prompt.
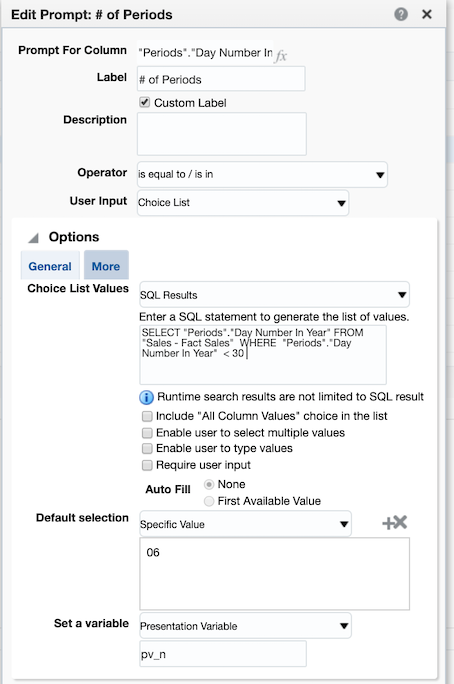
Here is the updated version of our filter using the number of periods presentation variable and a default value of 6, @{pv_n}{6}. We will refer to the following filter as Filter 2 (F2).

Our TIMESTAMPADD function is now fairly robust and will give us any date greater than or equal to the first day of the month from n months ago from any given date. Now we will see what we just created in action by creating date ranges to allow for a Year over Year analysis for any number of months. Consider the following filter set:
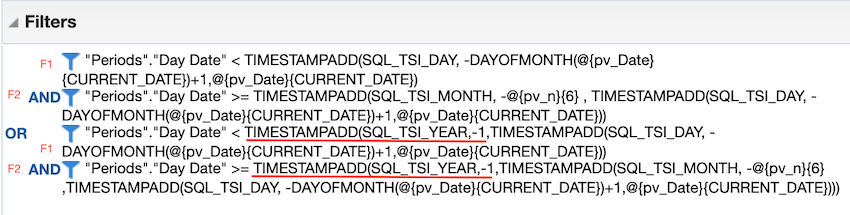
This may appear to be pretty intimidating at first but if we break it into parts we can start to understand its purpose. Notice we are using the exact same filters from before; Filter 1 and Filter 2. What we have done here is filtered on two time periods, separated by the OR statement.
- The first date range defines the period as being the most recent completed n months from any given prompted date value, using a presentation variable with a default of today. Dates in the current month have been removed from the set by Filter 1.
- The second time period, after the OR statement, is the exact same as the first only it has been wrapped in another TIMESTAMP function subtracting a year, giving you the exact same time frame for the year prior.
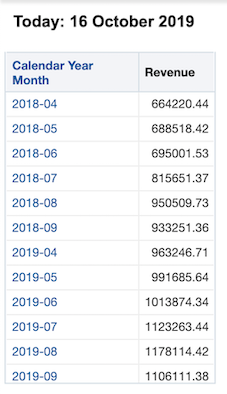
This allows us to create a report that can run a year over year analysis for a rolling n month time frame determined by the user.
A note on nested TIMESTAMPS: you will always want to create nested TIMESTAMPS with the smallest interval first. Then you will wrap intervals as necessary. In this case our smallest increment is day, wrapped by month, wrapped by year.
Let’s Go Crazy
A more advanced trick, If you use real time or near real time reporting: using CURRENT_DATE may be how you want to proceed. Otherwise, instead of using today as your default date value, use yesterday’s date since most data are only as current as yesterday. Using yesterday will be valuable especially when pulling reports on the first day of the month or year - you generally want the entire previous time period rather than the empty beginning of a new one. So, to implement, wherever you have @{pDate}{CURRENT_DATE} replace it with @{pDate}{TIMESTAMPADD(SQL_TSI_DAY,-1,CURRENT_DATE)}
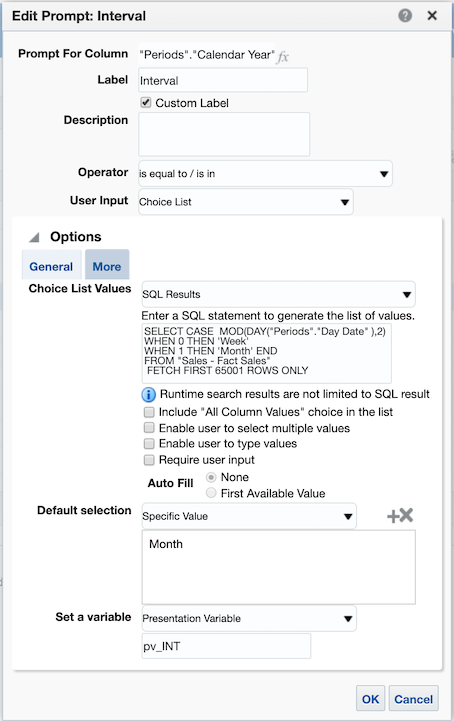
One more change on our filter to make it extra-flexible here is to use a new presentation variable to determine if you want to display year over year values, or by month, or by week. This can be done by inserting a variable into your SQL_TSI_MONTH and DAYOFMONTH statements; changing MONTH to SQL_TSI_@{pv_INT}{MONTH} and DAYOF@{pv_INT}{MONTH}, where pv_INT is the name of our variable.
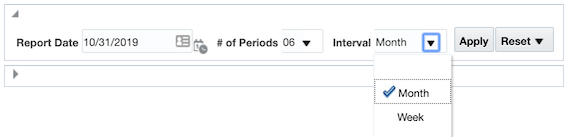
Start by creating a dummy variable in your prompt to allow users to select either MONTH or WEEK. You can try something like this: CASE MOD(DAY("Time"."Date"),2) WHEN 0 'WEEK' WHEN 1 THEN 'MONTH' END
The updated filter now look like this:
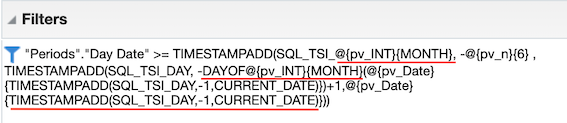
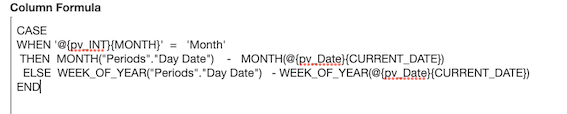
In order for our interaction between Month and Week to run smoothly we have to factor in one last consideration: if we are to take the date December 1st, 2019 and subtract one year we get December 1st, 2018. However, if we take the first day of this week, Sunday December 15, 2019 and subtract one year we get Saturday December 15, 2014. In our analysis this will cause an extra partial week to show up for prior years. To get around this we will add a case statement determining if '@{pv_INT}{MONTH}' = 'Week' THEN subtract 52 weeks from the first of the week ELSE subtract 1 year from the first of the month. With this, our final filter set will look like this:
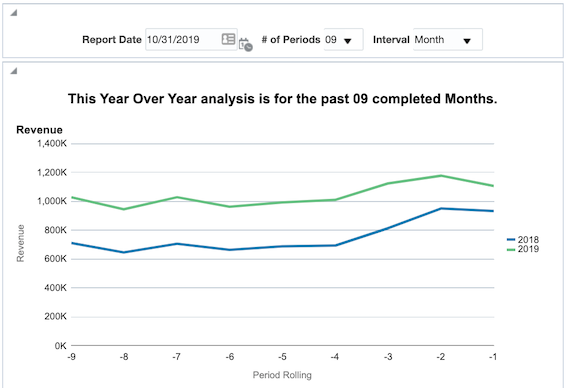
With the use of these filters and some creative dashboarding, you can construct a report that easily allows you to view a year over year analysis from any date in time for any number of periods either by month or by week.
Filtered by Week intervals;
The formula below will give you the value of period rolling to use in the analysis;
In this post, we created a cloud version of the amazing demo previously described by Brian Hall. As demonstrated, Timestamp functions and their power have been within the interesting topics of the visualisation and reporting for as long as we at Rittman Mead remember and can still be used in the realm of the Oracle Cloud Services in a very similar way as the past.
Feel free to get in touch, let us know your reviews and comments.
Real World OBIEE: Demystification of Variables Pt. 1
OBIEE has some very powerful features and capabilities when it comes to how we visualize and present our data. There are some features which almost everyone uses (filters, prompts, rename columns ect.) and then some that are less common. In part, I think there is a lot of "noise" that surrounds the explanation of some of these features. Another reason, and probably the most likely, is that a lot of report developers may just don't know that they exist. I can't tell you how many times in one of our training courses here at Rittman Mead that someone says "wow, I didn't know I could do that!" or that I get asked, "could you explain how Presentation Variables work?". Now, I am not saying that there is anything wrong with not knowing or being confused when it comes to some of the features in OBIEE. In fact, it's my main purpose in writing this blog series! I want to demystify and show you some of the features and techniques I have used with almost every client I have worked with. Even if you are a seasoned veteran, my goal is to present something in a way that you haven't heard before and spark some ideas in your day-to-day development. So with all of that said, let's dive into part one of the Demystification of Variables.
For the first part of this series, I want to talk about using Bins and Presentation Variables together at a report level and also in dashboard prompts. Before we dive into an example, let me talk a little bit about bins and presentation variables.
Bins
Sometimes we need to group values differently than what we have available from our column selection. Common examples could be when we need to group products differently than product category, when we need to create a group for items on sale or, maybe the most common I've seen, when we need to create custom groups for certain values and then have a group for the "others". Creating custom groups can be accomplished in a few different ways (selection steps, add new group from the Results tab), but the way I'm going to show you involves using the Bins tab under Edit formula within a column. I'll go over this process shortly when we dive into the example.
Presentation Variables
These are one of the most powerful features in Answers. They are also one of the things that trip people up the most. Think of presentation variables like placeholders and these placeholders are waiting for a value or a group of values to be passed into them. There are really only three parts to the presentation variables we will look at in this example: First you assign the presentation variable (give it a name) in a prompt to pass the value or group of values selected into the second part. The second part is where the placeholder (presentation variable with the same name) is put in a column formula, column heading, text object etc. The third part is called formatting. Formatting is used when you need to apply a certain format to the values coming into the presentation variable placeholder. There are a massive amount of use cases for presentation variables but I am going to cover only a couple of the ones that I've used the most.
Make sense? If you're still a little confused or hearing about this for the first time, don't worry. We are going to go through an example that I hope will explain the uses of Bins and Presentation Variables in a way that is concise and clear.
Now, lets dive into the example.
The Scenario
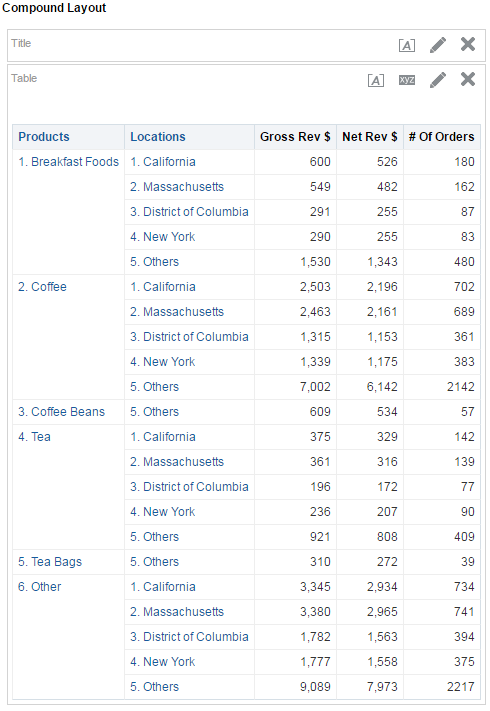
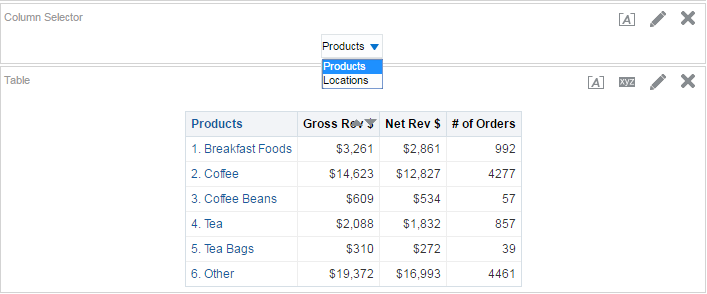
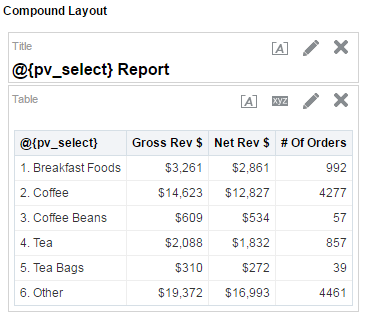
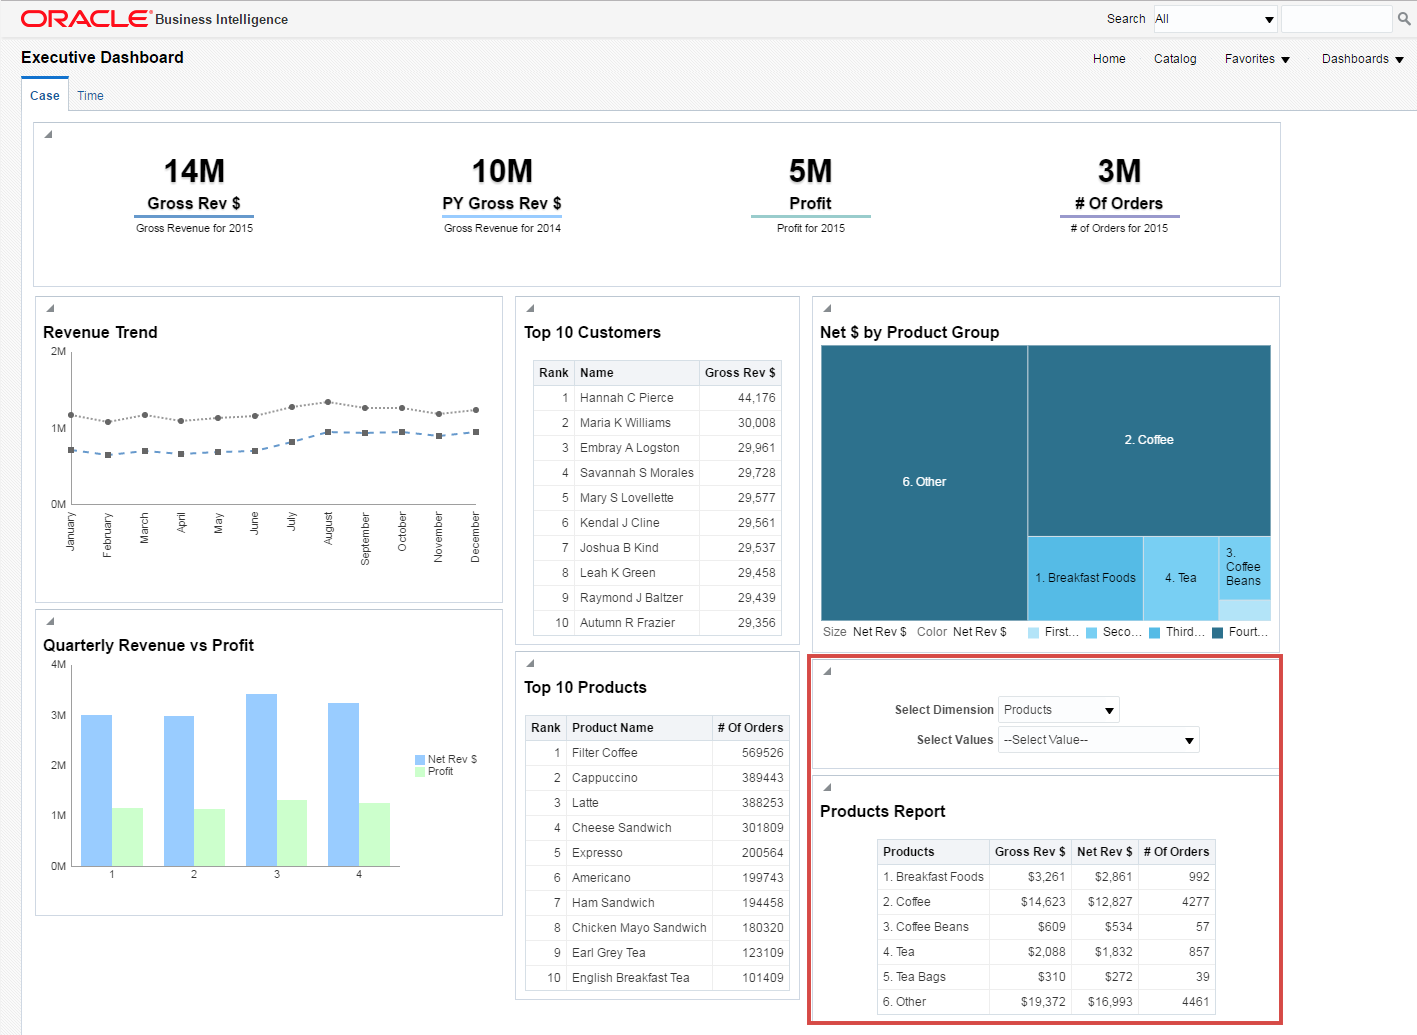
In this example, I am going to work through a hypothetical situation where I am the front-end developer for a coffee shop and I've been asked to create a report for an executive dashboard. The report needs to include Gross Revenue, Net Revenue and # of Orders for the current date for six groups of products (Breakfast Foods, Coffee, Coffee Beans, Tea, Tea Bags and Other) and five location groups which contain all the stores located in four states (California, Massachusetts, District of Columbia, New York and Others). The report needs to be in a table view and the person that requested this report also wants the ability to switch between the two columns for product groups and location groups. They also want a dashboard prompt for selecting from one or more groups for each column.
The Example
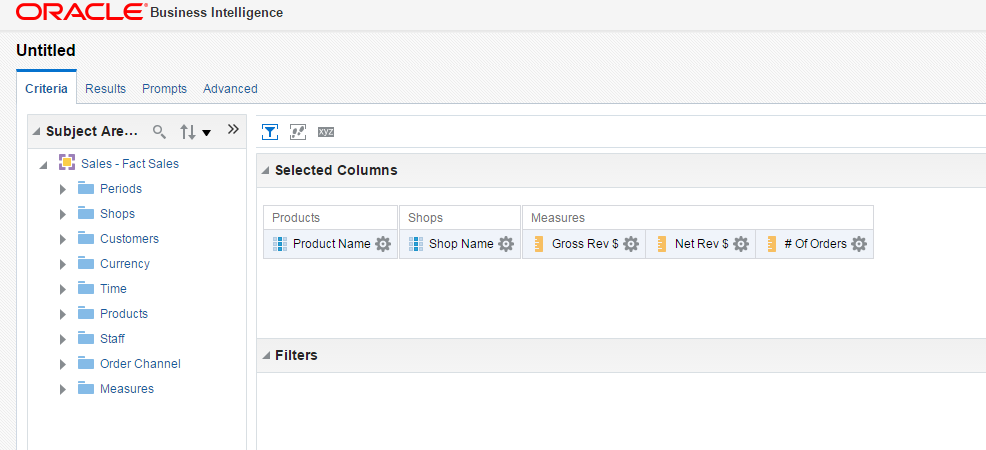
Let's start by tackling the custom groups. Since both groups are going to be created from the lowest level of detail for both products and locations, we need to bring in both Product Name and Shop Name columns and also our measures.
Note: For all of the examples in this blog series I am using OBIEE 12.2.1.2
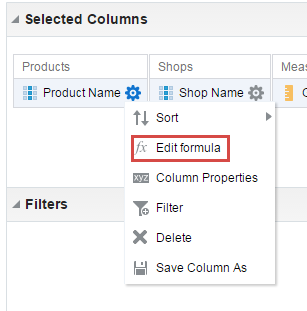
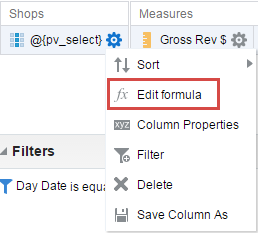
I can click on column properties > Edit Formula then click on the Bins tab to start creating my groups.
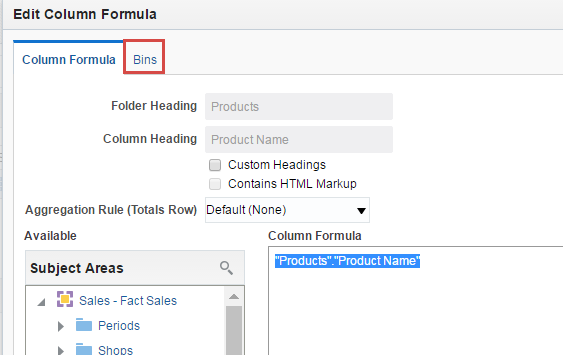
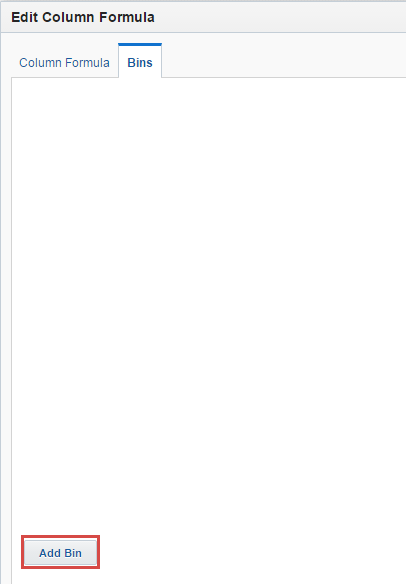
In the Bins tab, I can click on Add Bin to start creating my first group.
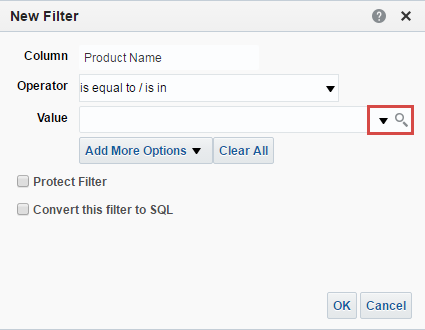
Once I click on Add Bin, I am presented with a New Filter window. The process of creating a new group (or bin) is exactly the same as creating a column filter. I can type the values individually, separated by ; or I can click on the search icon to add values manually. In this case, I am going to add them manually.
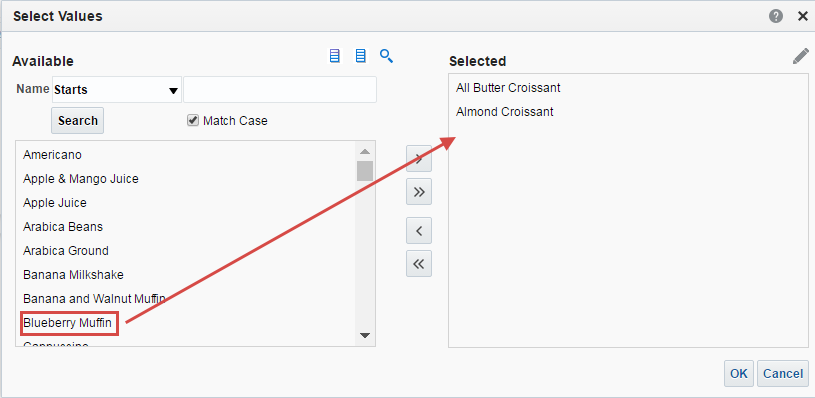
Once in the Select Values window, I am going to select all of the products that belong in the first group (Breakfast Foods).
Note: In this scenario, the person has given me a list of all the products and stores that they want in each group
Once I'm done adding all the items, clicking OK will take me to the Edit Bin Name window where I can give my new group (or Bin) a custom name.
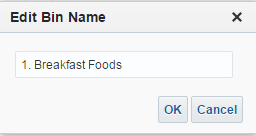
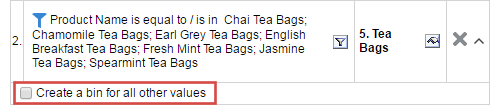
Since the person who requested the report probably wants the Others group to be last, I am going to add numerical values to each group. This will give me the flexibility to order columns any way that I choose. After I’m done creating all my Bins, there is a checkbox at the bottom of the Bins window where I can create a custom bin for all other values.
Clicking OK will return me to the Criteria where I can view the formula that OBIEE generated for all of my selections.
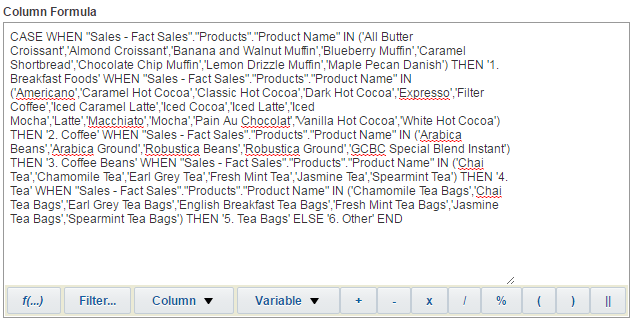
When using Bins, OBIEE generates a custom Case statement for us. At a high level, a Case statement takes a set of conditions and executes a corresponding statement. In other words, when the Product Name column has these values, put them all together an call them THIS.
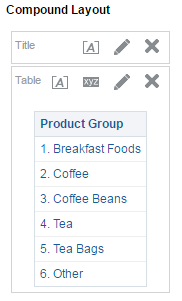
If I go to Results, I can see the Bins I just created.
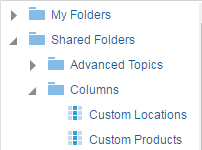
Now I can return to the Criteria to create the groups for the stores. Upon completion, here is the formula for the Locations:
And the result:
Now I need to come up with a way to be able to switch between the Product and Location columns I just created. There are a couple of options. Since i'm using OBIEE 12c, I can save both the Products and Locations columns to the web catalog and simply create a column selector just like I would do for any of the columns within a subject area.
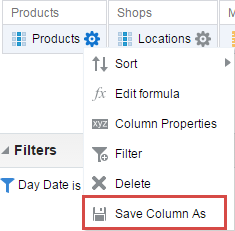
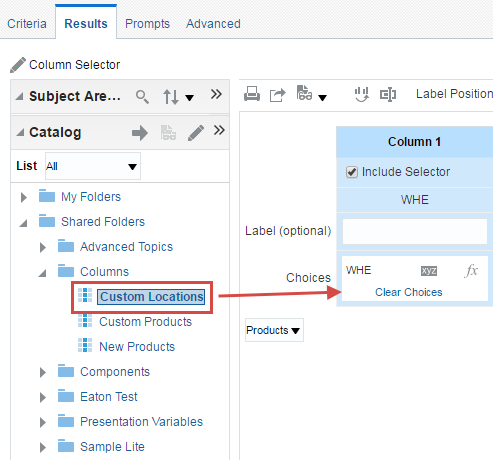
There are two problems with this method. One is that the Save Column As feature is only available from OBIEE 11.1.1.9 forward so, if you are still on 11.1.1.7 or earlier, this method won't work. The second problem is that the request is not just for swapping the Product and Location columns with a prompt but also being able to select individual values for each column with a prompt. To avoid confusion, we probably want the prompt values for each column to change dynamically depending on which column is selected. To accomplish this I am going to use a second method which requires me to do the following:
Combine the case statements for both Products and Locations column formulas
Insert two additional case statements along with presentation variables to allow me to switch between the two.
Create a filter for the combined column with a presentation variable to allow me to use prompted values.
Create a variable type dashboard prompt to select between the Product and Locations independently.
Create a dashboard prompt that dynamically changes between the value selections for the Products and Locations.
I'm going to start with the first two steps since they require editing the same column formula.
I am going to create a new column and copy both my Products and Locations column formulas into the new column's edit formula window and, to make it easier to edit and insert the two additional case statements, I am going to put a blank line between them.
Now I need to put in my two additional case statements with presentation variables so that I can switch between the two. The syntax and naming convention I am going to use is as follows:
CASE WHEN @{pv_select}['@']{'Products'} = 'Products' THEN [Products Case Statment]
CASE WHEN @{pv_select}['@']{'Products'} = 'Location' THEN [Locations Case Statment]
Let me take a moment to examine and explain the presentation variable I'm using.
The syntax for putting a presentation variable in a column formula, column heading or text object is as follows:
@{presentation_variable_name}[formatting]{default_value}
Note: I am going to use the presentation variable name (pv_select) in my variable prompt later in this example
The default value I have defined (Products) is an optional step that is primarily used for when I want to view my report without any values being passed into the presentation variable. The default value is used when no value has been passed into the presentation variable.
Notice that I have also included formatting between the presentation variable name and the default value (['@']). The reason for this is because the prompt values (which will be defined as Products and Locations in the variable prompt I will create) are a string (text) datatype and I have to explicitly define the format I need for the presentation variable value or I will get an error. You have to define formatting using single brackets [] and then encapsulate the @ character with the formatting you need applied to the presentation variable value. Think of the @ character as a sort of shorthand or an abbreviation for the presentation variable itself.
Note: I could enclose my presentation variable in single quotes to achieve the same results in this senario ('@{pv_select}{Products}').
So, to explain the entire statement another way:
CASE WHEN the value of the presentation variable coming from the prompt is equal to 'Products', THEN then use the CASE statment for the product groups
CASE WHEN the value of the presentation variable coming from the prompt is equal to 'Location', THEN then use the CASE statment for the location groups
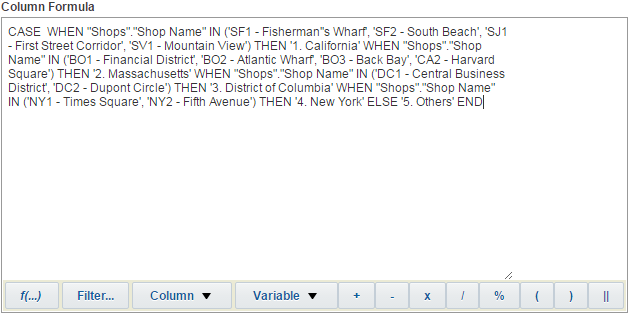
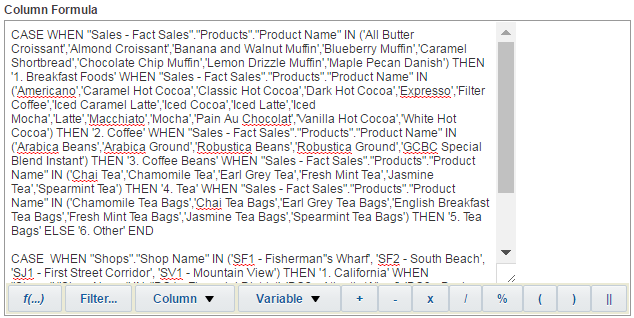
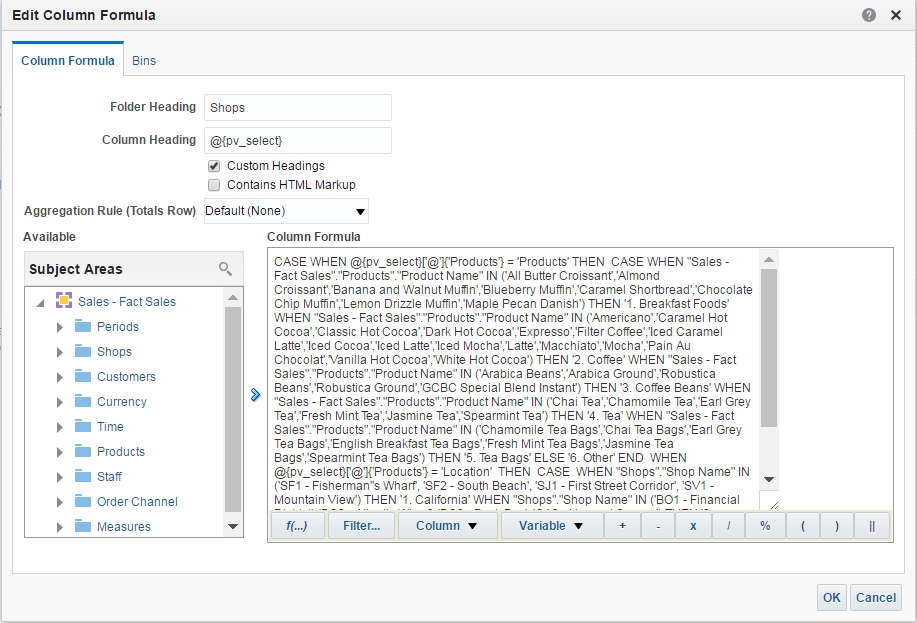
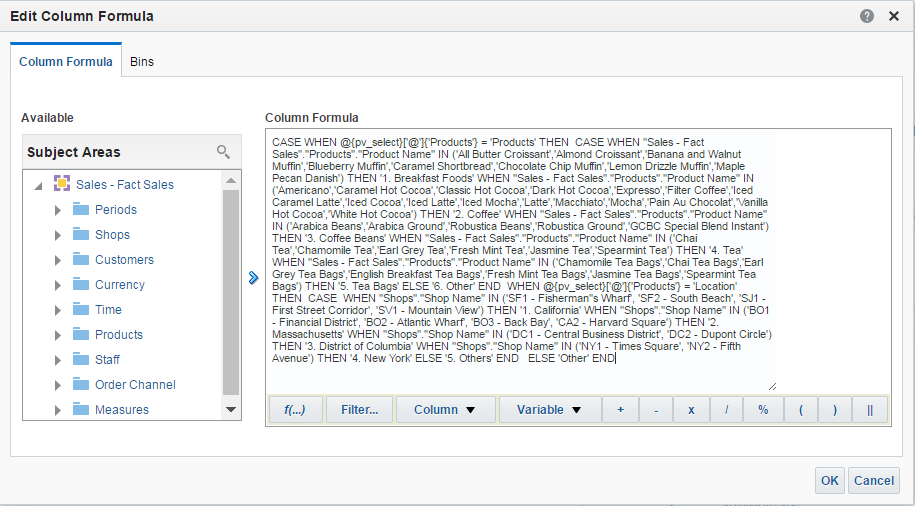
My new column formula is as follows:
CASE WHEN @{pv_select}['@']{Products} = 'Products' THEN
CASE WHEN "Sales - Fact Sales"."Products"."Product Name" IN ('All Butter Croissant','Almond Croissant','Banana and Walnut Muffin','Blueberry Muffin','Caramel Shortbread','Chocolate Chip Muffin','Lemon Drizzle Muffin','Maple Pecan Danish') THEN '1. Breakfast Foods' WHEN "Sales - Fact Sales"."Products"."Product Name" IN ('Americano','Caramel Hot Cocoa','Classic Hot Cocoa','Dark Hot Cocoa','Expresso','Filter Coffee','Iced Caramel Latte','Iced Cocoa','Iced Latte','Iced Mocha','Latte','Macchiato','Mocha','Pain Au Chocolat','Vanilla Hot Cocoa','White Hot Cocoa') THEN '2. Coffee' WHEN "Sales - Fact Sales"."Products"."Product Name" IN ('Arabica Beans','Arabica Ground','Robustica Beans','Robustica Ground','GCBC Special Blend Instant') THEN '3. Coffee Beans' WHEN "Sales - Fact Sales"."Products"."Product Name" IN ('Chai Tea','Chamomile Tea','Earl Grey Tea','Fresh Mint Tea','Jasmine Tea','Spearmint Tea') THEN '4. Tea' WHEN "Sales - Fact Sales"."Products"."Product Name" IN ('Chamomile Tea Bags','Chai Tea Bags','Earl Grey Tea Bags','English Breakfast Tea Bags','Fresh Mint Tea Bags','Jasmine Tea Bags','Spearmint Tea Bags') THEN '5. Tea Bags' ELSE '6. Other' END
WHEN @{pv_select}['@']{'Products'} = 'Location' THEN
CASE WHEN "Shops"."Shop Name" IN ('SF1 - Fisherman''s Wharf', 'SF2 - South Beach', 'SJ1 - First Street Corridor', 'SV1 - Mountain View') THEN '1. California' WHEN "Shops"."Shop Name" IN ('BO1 - Financial District', 'BO2 - Atlantic Wharf', 'BO3 - Back Bay', 'CA2 - Harvard Square') THEN '2. Massachusetts' WHEN "Shops"."Shop Name" IN ('DC1 - Central Business District', 'DC2 - Dupont Circle') THEN '3. District of Columbia' WHEN "Shops"."Shop Name" IN ('NY1 - Times Square', 'NY2 - Fifth Avenue') THEN '4. New York' ELSE '5. Others' END
ELSE 'Other' END*
I am also going to use the presentation variable in the column heading so that when I make my selection in the prompt, the column heading will reflect the selection as well.
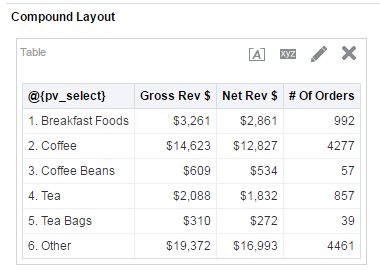
 If I go to my results, notice how only the Products column is showing due to the default value I set when defining my presentation variable.
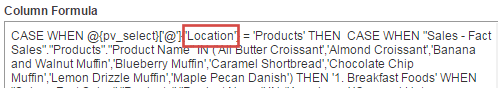
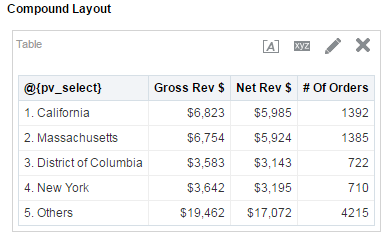
If I go back to my column formula and change the default value to be Location instead of Products, the column values will change to the ones defined in my Locations case statment.
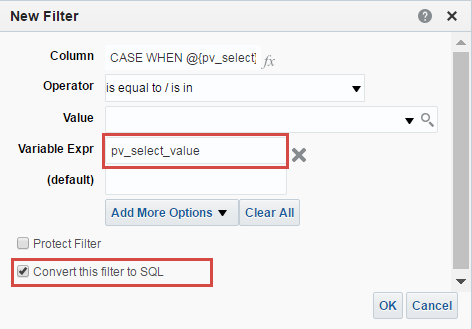
In order for the report to be filtered for individual values, I need to create a filter using a presentation variable. To do this I am going to create a filter for the column I used to define all of my groups and, instead of selecting a value, I am going to put in a new presentation variable which I will define later when I create the dashboard prompt for the values.
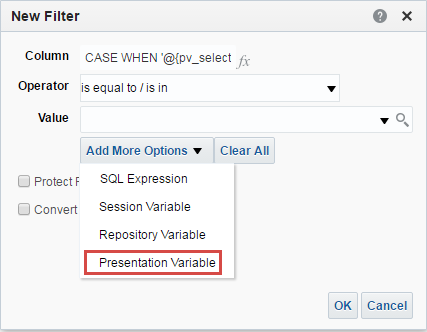
I am going to name my new presentation variable pv_select_value.
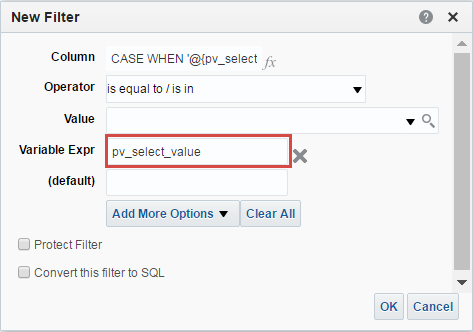
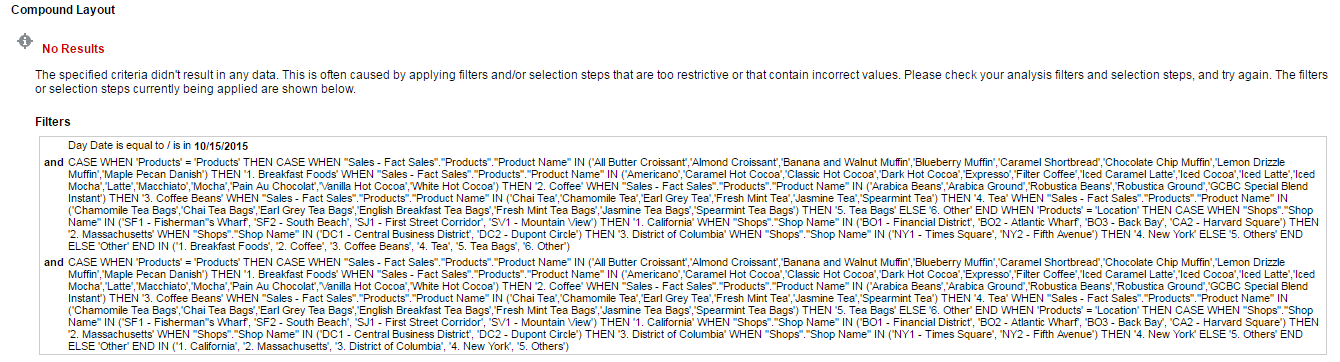
When a Presentation Variable is added to the filter, two new text boxes appear. The Variable Expr box is where you define the variable to be used and the (default) box is used to add a default value. Notice how I am not using the syntax @{presentation_variable_name}. When defining a presentation variable using the presentation variable option in a filter or in a prompt, you only have to define the name. Once I click ok, OBIEE will insert the proper syntax for me. The default value is optional but, when defining a Presentation Variable within a filter, you have to specify a default value in order to get any results within the analysis. If I run the report with just a presentation variable defined with no default value, I will get the error shown below:
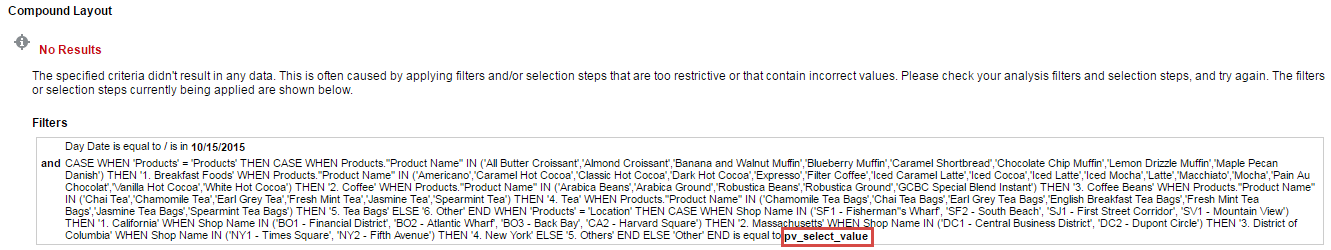
This is because, when the report is run, the query issued is trying to use the value of the presentation variable. Since there is no default value specified, it is trying to use the presentation variable name itself as a value. If I specify a default value or a list of default values, the report will use those values in the absence of a value or values in the presentation variable. Because I want all of the values to be shown initially on the dashboard, I am going to use the Convert this filter to SQL option and input all of the values for the product group manually for the list of default values.

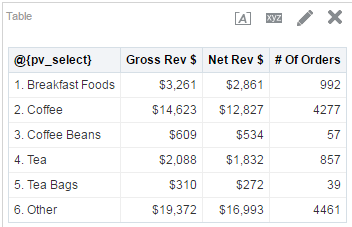
If I run the report with the default values specified, I get the results back for the product group.
In order for the filter to work with the column prompt I will create later in this example, it requires the [formatting] syntax to be used (@{pv_select_value}['@']{'1. Breakfast Foods', '2. Coffee', '3. Coffee Beans', '4. Tea', '5. Tea Bags', '6. Other'}) for example). This will encapsulate each value passed into the pv_select_value presentation variable with single quotes.
Now I need to add an additional filter on the same column using the same pv_select_value presentation variable. The reason for this is because I need to define each default value for the location group as well so that all of the values for location will be shown on the dashboard. To do this, I am going use the same process that I used for the product group filter.

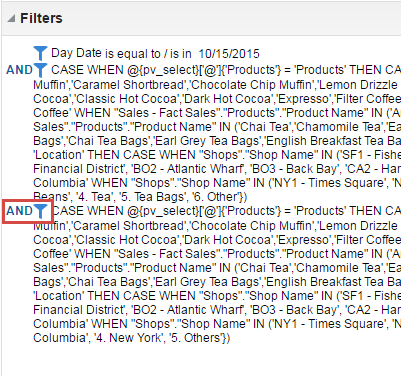
There is one additional step that I need to do in order to make the filter work for both products and locations. When you initially create report filters, OBIEE assumes that you want to use all filters together at the same time therefore it uses 'AND' for each filter created after the initial filter.
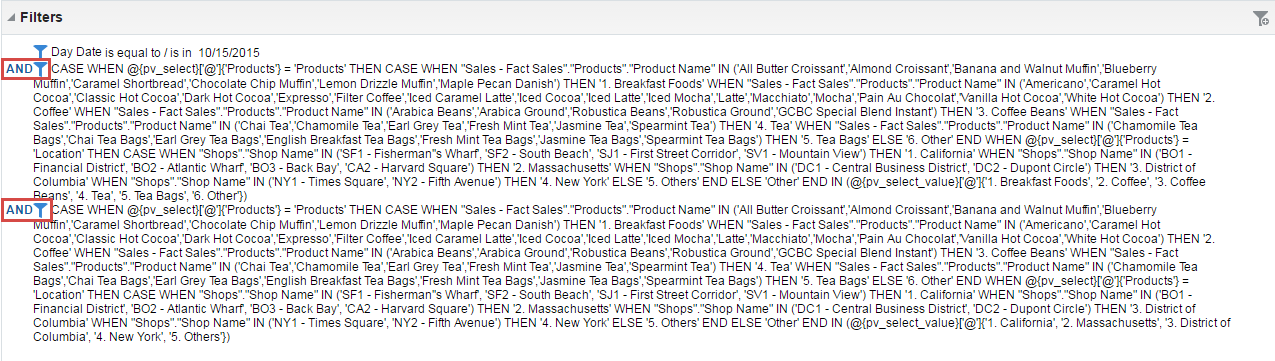
If I run the report, I will get an error because the filter is being applied for both the products and location values. Because the case statment is defined for products and locations independently, I can not use all values in a filter at the same time.
To fix this, I need to change the operator for the location filter from 'AND' to 'OR'. I can do this by simply clicking on the 'AND' icon.
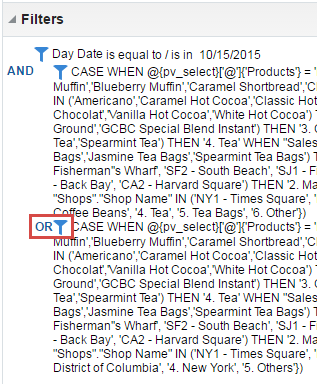
Now the report will run because only the first set of conditions for the product group filter is applied.
Now I need to create my two dashboard prompts: One for the initial selection between my two case statements for Products and Locations and one for the values.
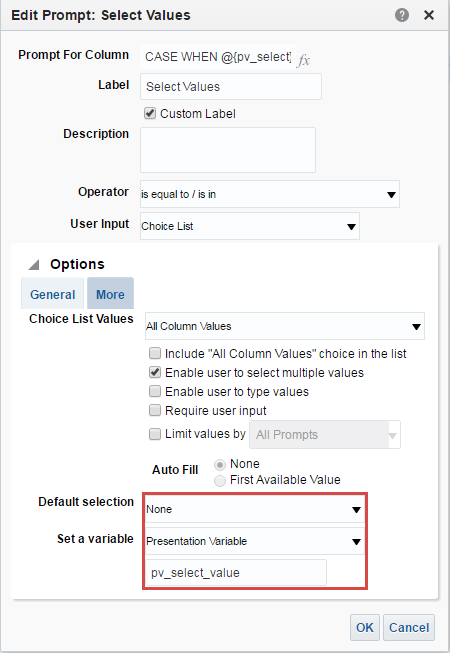
I start by creating a new dashboard prompt and create a new Variable Prompt.
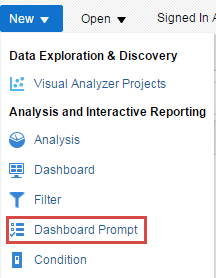
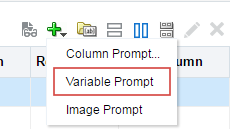
Because this is a variable prompt, I have to manually specify the values I want the user to be able to select from as well as define the presentation variable. Since I am creating the prompt for switching between the two case statements for Products and Locations, I am going to make the following selections and input the following values.
Prompt for: Presentation Variable > pv_select
User Input: Choice List
Choice List Values: Custom Values
Values: Products and Location
Default Selection: Specific Custom Value > Products
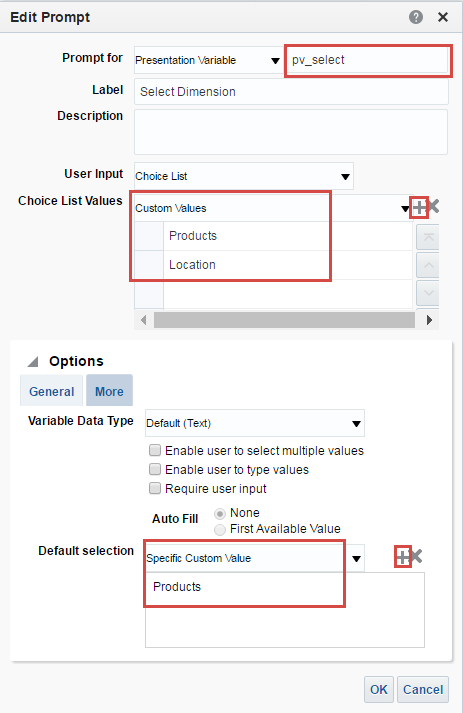
As you can see, I have defined the variable that we used in the column formula for the case statements. By defining the two custom values (Products and Location), I can select between the two case statements at will and, as far as the user is concerned, it will be just like using a column prompt within a report. Also, the default value needs to be specified for reasons I will explain when creating the next prompt for the values.
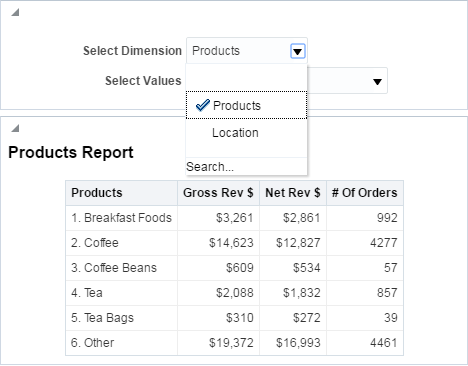
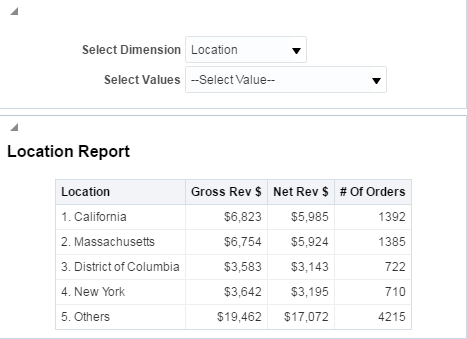
Now I am going to create a column prompt for the values.
First, I need to create a new column prompt and put in the same column formula that I used earlier in my report. I can do that by clicking on the fx icon and pasting in the column formula.
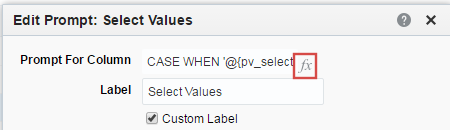
Essentially what I am doing is making the column values populate for the prompt by using the same case statement definitions and they will also change depending on the value selected in the prompt we created previously.
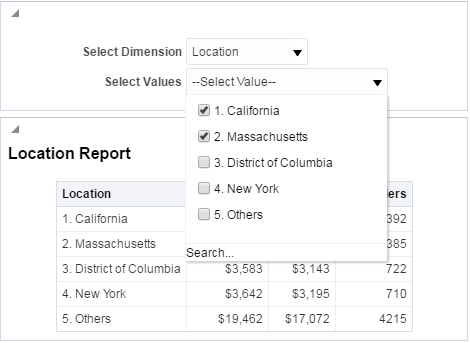
For the choice list of values, I can simply leave the default of All Column Values. Since the values will dynamically change depending on the initial prompt value in the variable prompt, it will only show values corresponding to each selection.
I do not need to define a default selection because I set the default values in the two filters I created in my report.
Finally, all that is left to do is define the pv_select_value presentation variable I defined for the filter of the case statement column in the report. This is how I will get all of the values to be shown for each initial prompt selection and also how I will select individual values. The default values will be passed into the filter via the pv_select_value presentation variable initially which will prompt all the values to be shown and then individual selections will be passed in the same way.
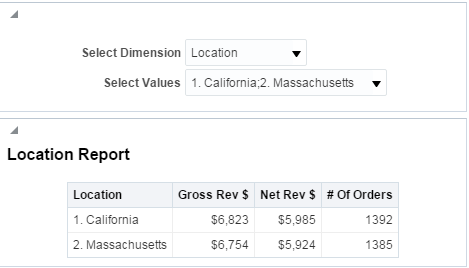
Here are the results when placed on the dashboard.
So that concludes part 1 of Demystification of Variables. Please feel free to ask questions or leave me a comment! In part 2, I am going to talk about using Repository, System and Presentation Variables to make reports dynamic for any series of time. Until next time.
Using the BI Server Metadata Web Service for Automated RPD Modifications
A little-known new feature of OBIEE 11g is a web service interface to the BI Server. Called the “BI Server Metadata Web Service” it gives a route into making calls into the BI Server using SOAP-based web services calls. Why is this useful? Because it means you can make any call to the BI Server (such as SAPurgeAllCache) from any machine without needing to install any OBIEE-related artefacts such as nqcmd, JDBC drivers, etc. The IT world has been evolving over the past decade or more towards a more service-based architecture (remember the fuss about SOA?) where we can piece together the functionality we need rather than having one monolithic black box trying to do everything. Being able to make use of this approach in our BI deployments is a really good thing. We can do simple things like BI Server cache management using a web service call, but we can also do more funky things, such as actually updating repository variable values in real time – and we can do it from within our ETL jobs, as part of an automated deployment script, and so on.
Calling the BI Server Metadata Web Service
First off, let’s get the web service configured and working. The documentation for the BI Server Metadata Web Service can be found here, and it’s important to read it if you’re planning on using this. What I describe here is the basic way to get it up and running.
Configuring Security
We need to configure the security against the web service to define what kind of authentication is required by it to use. If you don’t do this, you won’t be able to make calls to it. Setting up the security is a case of attaching a security policy in WebLogic Server to the web service (called AdminService) itself. I’ve used oracle/wss_http_token_service_policy which means that the credentials can be passed through using standard HTTP Basic authentication.
You can do this through Enterprise Manager:


Or you can do it through WLST using the attachWebServicePolicy call.
You also need to configure WSM, adding some entries to the credential store as detailed here.
Testing the Web Service
The great thing about web services is that they can be used from pretty much anywhere. Many software languages will have libraries for making SOAP calls, and if they don’t, it’s just HTTP under the covers so you can brew your own. For my testing I’m using the free version of SoapUI. In anger, I’d use something like curl for a standalone script or hook it up to ODI for integration in the batch.
Let’s fire up SoapUI and create a new project. Web services provide a Web Service Definition Language (WSDL) that describes what and how they work, which is pretty handy. We can pass this WSDL to SoapUI for it to automatically build some sample requests for us. The WSDL for this web service is
http://<biserver>:<port>/AdminService/AdminService?WSDL
Where biserver is your biserver (duh) and port is the managed server port (usually 9704, or 7780).

We’ve now got a short but sweet list of the methods we can invoke:

Expand out callProcedureWithResults and double click on Request 1. This is a template SOAP message that SoapUI has created for you, based on the WSDL.

Edit the XML to remove the parameters section, and just to test things out in procedureName put GetOBISVersion(). Your XML request should look like this:
<soapenv:Envelope xmlns:soapenv="http://schemas.xmlsoap.org/soap/envelope/" xmlns:ws="http://ws.admin.obiee.oracle/">
   <soapenv:Header/>
   <soapenv:Body>
      <ws:callProcedureWithResults>
         <procedureName>GetOBISVersion()</procedureName>
      </ws:callProcedureWithResults>
   </soapenv:Body>
</soapenv:Envelope>
If you try and run this now (green arrow or Cmd-Enter on the Mac) you’ll see the exact same XML appear on the right pane, which is strange… but click on Raw and you’ll see what the problem is :

Remember the security stuff we set up on the server previously? Well as the client we now need to keep our side of the bargain, and pass across our authentication with the SOAP call. Under the covers this is a case of sending HTTP Basic auth (since we’re using oracle/wss_http_token_service_policy), and how you do this depends on how you’re making the call to the web service. In SoapUI you click on the Auth button at the bottom of the screen, Add New Authentication, Type: Basic, and then put your OBIEE server username/password in.

Now you can click submit on the request again, and you should see in the response pane (on the right) in the XML view details of your BI Server version (you may have to scroll to the right to see it)

This simple test is just about validating the end-to-end calling of a BI Server procedure from a web service. Now we can get funky with it….
Updating Repository Variables Programatically
Repository variables in OBIEE are “global”, in that every user session sees the same value. They’re often used for holding things like “what was the last close of business date”, or “when was the data last updated in the data warehouse”. Traditionally these have been defined as dynamic repository variables with an initialisation block that polled a database query on a predefined schedule to get the current value. This meant that to have a variable showing when your data was last loaded you’d need to (a) get your ETL to update a row in a database table with a timestamp and then (b) write an init block to poll that table to get the value. That polling of the table would have to be as frequent as you needed in order to show the correct value, so maybe every minute. It’s kinda messy, but it’s all we had. Here I’d like to show an alternative approach.
Let’s say we have a repository variable, LAST_DW_REFRESH. It’s a timestamp that we use in report predicates and titles so that when they are run we can show the correct data based on when the data was last loaded into the warehouse. Here’s a rather over-simplified example:

The Title view uses the code:
Data correct as of: @{biServer.variables['LAST_DW_REFRESH']}
Note that we’re referencing the variable here. We could also put it in the Filter clause of the analysis. Somewhat tenuously, let’s imagine we have a near-realtime system that we’re federating a DW across direct from OLTP, and we just want to show data from the last load into the DW:

For the purpose of this example, the report is less important than the diagnostics it gives us when run, in nqquery.log. First we see the inbound logical request:
-------------------- SQL Request, logical request hash:
45f9492a
SET VARIABLE QUERY_SRC_CD='Report',PREFERRED_CURRENCY='USD';SELECT
   0 s_0,
   "A - Sample Sales"."Time"."T05 Per Name Year" s_1,
   "A - Sample Sales"."Base Facts"."1- Revenue" s_2
FROM "A - Sample Sales"
WHERE
("Time"."T00 Calendar Date" <  VALUEOF("LAST_DW_REFRESH"))
ORDER BY 1, 2 ASC NULLS LAST
FETCH FIRST 5000001 ROWS ONLY
Note the VALUEOF clause. When this is parsed out we get to see the actual value of the repository variable that OBIEE is going to execute the query with:
-------------------- Logical Request (before navigation): [[
RqList
    0 as c1 GB,
    D0 Time.T05 Per Name Year as c2 GB,
    1- Revenue:[DAggr(F0 Sales Base Measures.1- Revenue by [ D0 Time.T05 Per Name Year] )] as c3 GB
DetailFilter:
    D0 Time.T00 Calendar Date < TIMESTAMP '2015-09-24 23:30:00.000'
OrderBy: c1 asc, c2 asc NULLS LAST
We can see the value through the Administration Tool Manage Sessions page too, but it’s less convenient for tracking in testing:

If we update the RPD online with the Administration Tool (nothing fancy at this stage) to change the value of this static repository variable :

And then rerun the report, we can see the value has changed:
-------------------- Logical Request (before navigation): [[
RqList
    0 as c1 GB,
    D0 Time.T05 Per Name Year as c2 GB,
    1- Revenue:[DAggr(F0 Sales Base Measures.1- Revenue by [ D0 Time.T05 Per Name Year] )] as c3 GB
DetailFilter:
    D0 Time.T00 Calendar Date < TIMESTAMP '2015-09-25 00:30:00.000'
OrderBy: c1 asc, c2 asc NULLS LAST
Now let’s do this programatically. First off, the easy stuff, that’s been written about plenty before. Using biserverxmlgen we can create a XUDML version of the repository. Searching through this we can pull out the variable definition:
<Variable name="LAST_DW_REFRESH" id="3031:286125" uid="00000000-1604-1581-9cdc-7f0000010000">
<Expr><![CDATA[TIMESTAMP '2015-09-25 00:30:00']]></Expr>
</Variable>
and then wrap it in the correct XML structure and update the timestamp we want to use:
<?xml version="1.0" encoding="UTF-8" ?>
<Repository xmlns:xsi="http://www.w3.org/2001/XMLSchema-instance">
    <DECLARE>
        <Variable name="LAST_DW_REFRESH" id="3031:286125" uid="00000000-1604-1581-9cdc-7f0000010000">
        <Expr><![CDATA[TIMESTAMP '2015-09-26 00:30:00']]></Expr>
        </Variable>
    </DECLARE>
</Repository>
(you can also get this automagically by modifying the variable in the RPD, saving the RPD file, and then comparing it to the previous copy to generate a patch file with the Administration Tool or comparerpd)
Save this XML snippet, with the updated timestamp value, as last_dw_refresh.xml. Now to update the value on the BI Server in-flight, first using the OBIEE tool biserverxmlcli. This is available on all OBIEE servers and client installations – we’ll get to web services for making this update call remotely in a moment.
biserverxmlcli -D AnalyticsWeb -R Admin123 -U weblogic -P Admin123 -I last_dw_refresh.xml
Here -D is the BI Server DSN, -U / -P are the username/password credentials for the server, and the -R is the RPD password.
Running the analysis again shows that it is now working with the new value of the variable:
-------------------- Logical Request (before navigation): [[
RqList
    0 as c1 GB,
    D0 Time.T05 Per Name Year as c2 GB,
    1- Revenue:[DAggr(F0 Sales Base Measures.1- Revenue by [ D0 Time.T05 Per Name Year] )] as c3 GB
DetailFilter:
    D0 Time.T00 Calendar Date < TIMESTAMP '2015-09-26 00:30:00.000'
OrderBy: c1 asc, c2 asc NULLS LAST
Getting Funky – Updating RPD from Web Service
Let’s now bring these two things together – RPD updates (in this case to update a variable value, but could be anything), and BI Server calls.
In the above web service example I called the very simple GetOBISVersion. Now we’re going to use the slightly more complex NQSModifyMetadata. This is actually documented, and what we’re going to do is pass across the same XUDML that we sent to biserverxmlcli above, but through the web service. As a side note, you could also do this over JDBC if you wanted (under the covers, AdminService is just a web app with a JDBC connector to the BI Server).
I’m going to do this in SoapUI here for clarity but I actually used SUDS to prototype it and figure out the exact usage.
So as a quick recap, this is what we’re going to do:
- Update the value of a repository variable, using XUDML. We generated this XUDML from
biserverxmlgenand wrapped it in the correct XML structure.
We could also have got it throughcomparerpdor the Administration Tool ‘create patch’ function - Use the BI Server’s NQSModifyMetadata call to push the XUDML to the BI Server online.
We saw thatbiserverxmlclican also be used as an alternative to this for making online updates through XUDML. - Use the BI Server Metadata Web Service (AdminService) to invoke the NQSModifyMetadata call on the BI Server, using the callProcedureWithResults method
In SoapUI create a new request:

Set up the authentication:

Edit the XML SOAP message to remove parameters and specify the basic BI Server call:
<soapenv:Envelope xmlns:soapenv="http://schemas.xmlsoap.org/soap/envelope/" xmlns:ws="http://ws.admin.obiee.oracle/">
   <soapenv:Header/>
   <soapenv:Body>
      <ws:callProcedureWithResults>
         <procedureName>NQSModifyMetadata()</procedureName>
      </ws:callProcedureWithResults>
   </soapenv:Body>
</soapenv:Envelope>
Now the tricky bit – we need to cram the XUDML into our XML SOAP message. But, XUDML is its own kind of XML, and all sorts of grim things happen here if we’re not careful (because the XUDML gets swallowed up into the SOAP message, it all being XML). The solution I came up with (which may not be optimal…) is to encode all of the HTML entities, which a tool like this does (and if you’re using a client library like SUDS will happen automagically). So our XUDML, with another new timestamp for testing:
<?xml version="1.0" encoding="UTF-8" ?>
<Repository xmlns:xsi="http://www.w3.org/2001/XMLSchema-instance">
    <DECLARE>
        <Variable name="LAST_DW_REFRESH" id="3031:286125" uid="00000000-1604-1581-9cdc-7f0000010000">
        <Expr><![CDATA[TIMESTAMP '2015-09-21 00:30:00']]></Expr>
        </Variable>
    </DECLARE>
</Repository>
becomes:
<?xml version="1.0" encoding="UTF-8" ?> <Repository xmlns:xsi="http://www.w3.org/2001/XMLSchema-instance"> <DECLARE> <Variable name="LAST_DW_REFRESH" id="3031:286125" uid="00000000-1604-1581-9cdc-7f0000010000"> <Expr><![CDATA[TIMESTAMP '2015-09-21 00:30:00']]></Expr> </Variable> </DECLARE> </Repository>
We’re not quite finished yet. Because this is actually a call (NQSModifyMetadata) nested in a call (callProcedureWithResults) we need to make sure NQSModifyMetadata gets the arguments (the XUDML chunk) through intact, so we wrap it in single quotes – which also need encoding ('):
'<?xml version="1.0" encoding="UTF-8" ?> <Repository xmlns:xsi="http://www.w3.org/2001/XMLSchema-instance"> <DECLARE> <Variable name="LAST_DW_REFRESH" id="3031:286125" uid="00000000-1604-1581-9cdc-7f0000010000"> <Expr><![CDATA[TIMESTAMP '2015-09-21 23:30:00']]></Expr> </Variable> </DECLARE> </Repository>'
and then for final good measure, the single quotes around the timestamp need double-single quoting:
'<?xml version="1.0" encoding="UTF-8" ?> <Repository xmlns:xsi="http://www.w3.org/2001/XMLSchema-instance"> <DECLARE> <Variable name="LAST_DW_REFRESH" id="3031:286125" uid="00000000-1604-1581-9cdc-7f0000010000"> <Expr><![CDATA[TIMESTAMP ''2015-09-21 23:30:00'']]></Expr> </Variable> </DECLARE> </Repository>'
Nice, huh? The WSDL suggests that parameters for these calls should be able to be placed within the XML message as additional entities, which I wonder if would allow for proper encoding, but I couldn’t get it to work (I kept getting java.sql.SQLException: Parameter 1 is not bound).
So, stick this mess of encoding plus twiddles into your SOAP message and it should look like this: (watch out for line breaks; these can break things)
<soapenv:Envelope xmlns:soapenv="http://schemas.xmlsoap.org/soap/envelope/" xmlns:ws="http://ws.admin.obiee.oracle/">
<soapenv:Header/>
<soapenv:Body>
<ws:callProcedureWithResults>
<procedureName>NQSModifyMetadata('<?xml version="1.0" encoding="UTF-8" ?> <Repository xmlns:xsi="http://www.w3.org/2001/XMLSchema-instance"> <DECLARE> <Variable name="LAST_DW_REFRESH" id="3031:286125" uid="00000000-1604-1581-9cdc-7f0000010000"> <Expr><![CDATA[TIMESTAMP ''2015-09-21 23:30:00'']]></Expr> </Variable> </DECLARE> </Repository>')</procedureName>
</ws:callProcedureWithResults>
</soapenv:Body>
</soapenv:Envelope>

Hit run, and with a bit of luck you’ll get a “nothing to report” response :

If you look in nqquery.log you’ll see:
[...] NQSModifyMetadata started.
[...] NQSModifyMetadata finished successfully.
and all-importantly when you run your report, the updated variable will be used:
-------------------- Logical Request (before navigation): [[
RqList
    0 as c1 GB,
    D0 Time.T05 Per Name Year as c2 GB,
    1- Revenue:[DAggr(F0 Sales Base Measures.1- Revenue by [ D0 Time.T05 Per Name Year] )] as c3 GB
DetailFilter:
D0 Time.T00 Calendar Date < TIMESTAMP '2015-09-21 23:30:00.000'
OrderBy: c1 asc, c2 asc NULLS LAST
If this doesn’t work … well, best of luck. Use nqquery.log, bi_server1.log (where the AdminService writes some diagnostics) to try and trace the issue. Also test calling NQSModifyMetadata from JDBC (or ODBC) directly, and then add in the additional layer of the web service call.
So, in the words of Mr Rittman, there you have it. Programatically updating the value of repository variables, or anything else, done online, and for bonus points done through a web service call making it possible to use without any local OBIEE client/server tools.
OBIEE Presentation variable defaulted by a session variable
Did this one on the OTN forum. Open the filter and add a presentation variable:

Say P_SELECT_DATE

Add a default date well outside the feasible range.
Press add more options and add a session variable LAST_REFRESH_DATE:

The filter will now look like:
![]()
Till Next Time
OBIEE VALUELISTOF(NQ_SESSION.VAR_NAME)
On of the lesser known (and documented) features is the use of VALUELISTOF(NQ_SESSION.VAR_NAME) in the RPD.
As far as I know it’s only available in a session init block.
Let’s assume we have a row wise initiate variable called GeoArea:


This one is populated from our authorisation database and tells the system which areas a user is allowed to see.
Since we can only use single row session variables in the rest of the OBIEE system we have to transform it to a single string.
For this we can use the oracle LISTAGG function (see: http://download.oracle.com/docs/cd/E14072_01/server.112/e10592/functions087.htm)
We make a new init block with:

SELECT LISTAGG ( COUNTRY_NAME, '; ') WITHIN GROUP (ORDER BY AREA)
from (select distinct AREA , COUNTRY_NAME from SAMP_ADDRESSES_D ) T
WHERE AREA IN (VALUELISTOF(NQ_SESSION.GeoArea))
If we take a peek in the log we see that BI-server is translating this to:
SELECT LISTAGG ( COUNTRY_NAME, '; ') WITHIN GROUP (ORDER BY AREA) from (select distinct AREA , COUNTRY_NAME from SAMP_ADDRESSES_D ) T
WHERE AREA IN ('West','North','Central','South','South America','Northern','Middle East','East','North Africa','North America','Africa','Europe','Eastern')
The result we put in a session variable called GEO_COUNTRY_LIST.
Be sure to set the order in which the session variables should be loaded:
![]()
This variable we can use for a data restriction on the Logical Table Source of our address table.
Till Next Time

