Tag Archives: Performance
OBIEE Component Status Notifications
At Rittman Mead, we often hear requests for features or solutions generally not provided by Oracle. These requests range from commentary functionality to custom javascript visualizations. There are many ways to implement these functionalities, but organizations often lack the in-house resources to engineer an acceptable solution.
Rittman Mead has the capability to engineer any solution desired, and in many cases, has already developed a solution. Many of our accelerators currently offered, such as Chit Chat or User Engagement, grew out of numerous requests for these features.
One of the more common requests we hear at Rittman Mead is for BI Administrators to receive notifications for the status of their OBIEE components. They want to be notified of the status of the system components throughout the day in a convenient manner, so any failures are recognized quickly.
This particular feature can easily be implemented with Rittman Mead's Performance Analytics service. However, Rittman Mead would like to publicly provide this capability independent of our accelerator. We have developed a small Python script to provide this functionality, and we would like to give this script to the community.
The provided script is available free of charge, and available under the MIT license. It has been tested on both OBIEE 11G and 12C environments, as well as on Windows and Linux operating systems. The rest of this blog will detail, at a high level, how the script works, and how to configure it correctly.
The script is available through our public Github repository here.
Script Output
First, let's clarify how we will gather the status of the components in the first place. Thankfully, OBIEE includes some scripts to display this information on both Linux and Windows. In 12C, the script is status.sh/status.cmd, and in 11G the primary command is opmnctl status.
When I execute this script on an OBIEE 12C OEL environment, I receive the following response:
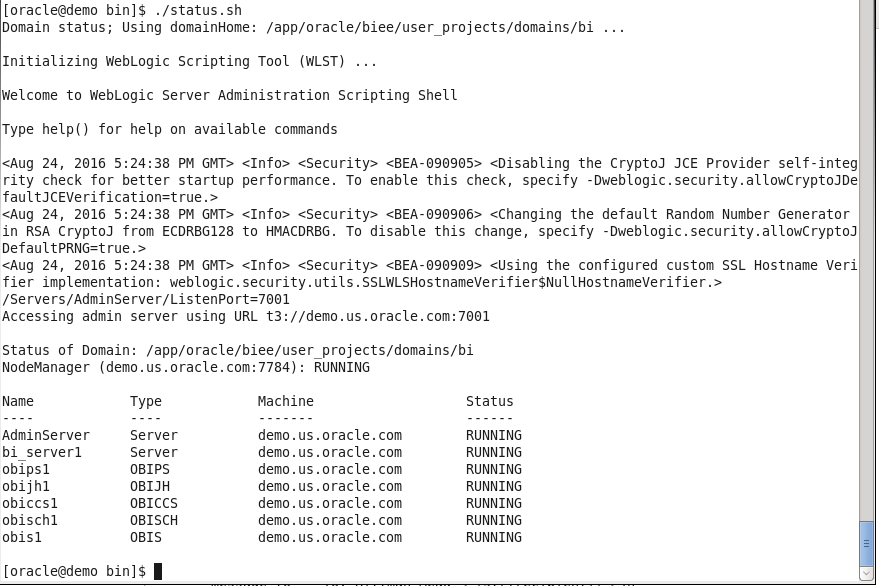
The output includes some extra information we don't require, but we can ignore it for now. With some programming knowledge, we can trim what we don't need, organize it into a nice table, and then send the output to nearly anywhere desired. For portability and stability, I will use Python to organize the message contents and I will also use email as the channel of communication.
Sending the Output Through Email
If we are only concerned with notifying administrators of the current status, one of the better avenues to send this data is through email. An email destination will allow users to be able to receive the status of the components almost instantaneously, and be able to take the appropriate action as soon as possible.
Additionally, Python's standard set of modules includes functions to assist in sending SMTP messages, making the script even more portable and maintainable. The simplest method to generate the email is just by sending the complete output as the body of the message. An example of this output is below:
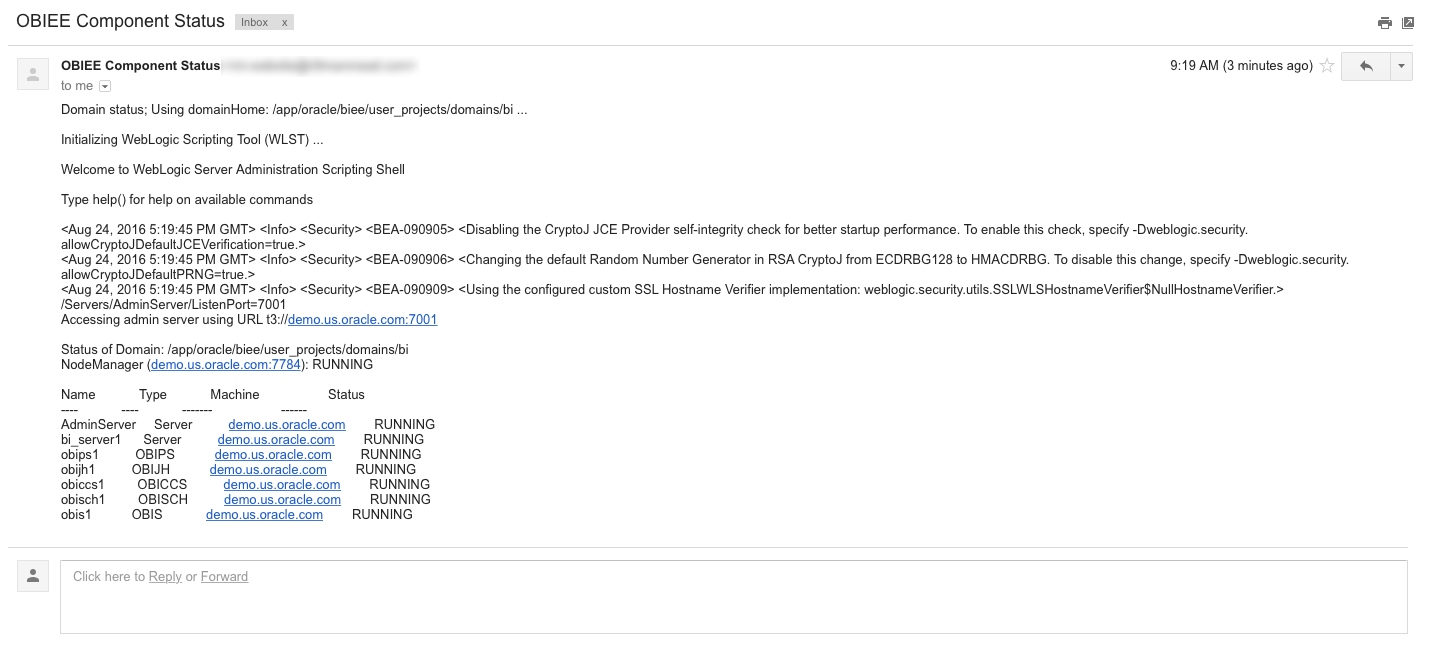
While this works, it's not exactly attractive. With some Python and HTML/CSS skills, we can style the email to look much nicer:
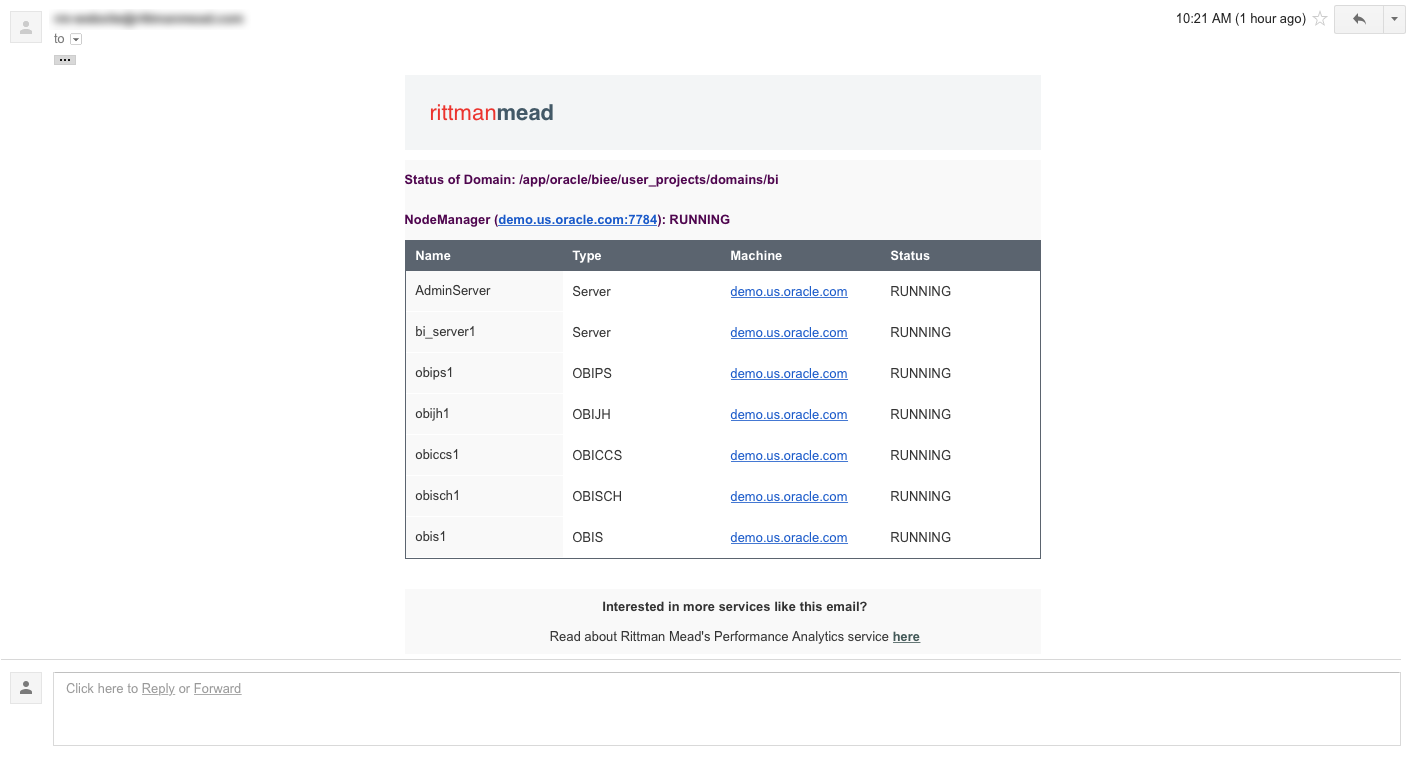
Now we have something nice we can send BI Administrators to show the status of the components.
Configuration and Use
To effectively utilize this script, you will have to change some of the configuration parameters, located at the top of the script. The parameters I am using are shown below (with sensitive information hidden, of course):
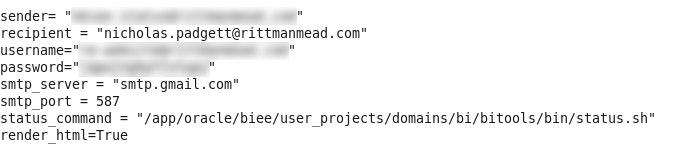
The sender and username fields should both be the user you are logging in as on the SMTP server to send the email. If you want the email address shown on a message to be different than the user configured on the SMTP server, then these can be set separately. The password field should be the password for the user being configured on the SMTP server.
The recipient field should be the address of the user who will be receiving the emails. For simple management, this should be a single user, who should then be configured to forward all incoming status emails to the responsible parties. This will allow easier maintenance, since modifying the list of users can take place in the email configuration, rather than the script configuration. In this example, I am just sending the emails to my Rittman Mead email address.
The SMTP settings should also be updated to reflect the SMTP server being utilized. If you are using Gmail as the SMTP server, then the configuration shown should work without modifications.
Finally, the python script requires the absolute path to the status command to execute to produce the output (the opmnctl or status commands). Environment variables may not be taken into consideration by this script, so it's best to not use a variable in this path.
NOTE: If the \ character is in the path, then you MUST use \\ instead. This is especially true on Windows environments. If this change is required but omitted, the script will not function properly.
Additionally, if you don't care about the HTML output (or if it doesn't render nicely in your email client), then it can be disabled by setting the value of render_html to False. If, for some reason, the nice HTML fails to render, then the email will just send the plain text output, instead of failing to deliver an email at all.
Once configured, try executing the script:
python email_component_status.py
If everything worked correctly, then you should have received an email with the status of the components. If you do not receive an email, then you should check both the configuration settings, and the internet connection of the machine (firewalls included). The script will also generate output that should assist you in troubleshooting the cause of the problem.
Additional Notifications or Destinations
The solution provided, while useful, is not perfect. What if you want to send this information to a destination other than an email address, such as a ticketing system like Atlassian JIRA? Or what if you want notifications based on other situations, such as slow running reports, or high CPU usage?
There may be many situations in which you would want one, or several, employees to receive different notifications based on events or circumstances that occur in your OBIEE environment. The script in this blog post only provides one of these notifications, but implementing many more will quickly become burdensome.
As part of Rittman Mead's Performance Analytics offering, we include custom software and code to fulfill this requirement. In addition to providing dashboards to explore the performance of your OBIEE systems, Performance Analytics can be configured to distribute alerts, based on any quantifiable condition, to any number of external systems.
The full Performance Analytics suite can not only alert users of down system components, but of any number of conditions that may occur in your BI environment.
If you have questions about this script, Performance Analytics, or anything else Contact Us here.
To find out more about Performance Analytics, contact us, visit the product page here, or read some of the fantastic blogs from Robin Moffatt.
New Performance Analytics Release
Poor performance is one of the most common complaints we hear upon arrival to customer sites, and often for good reason. When users have time to “make the rounds” before the system returns a result (if it returns a result at all), they have the right to be frustrated.
Unfortunately, tracking down the origins of performance issues can be extremely difficult, as the root cause could be one or more problems across several distinct systems. Without a comprehensive view of the complete technology stack, an administrator will effectively be guessing.
But we are all in the business of analytics. We should be taking an analytical approach to drive our decisions, and provide evidence to support them. Performance data should be collected, investigated, and then acted upon. But an analytical approach raises two distinct questions, “What data can we collect that will help us identify performance issues, and once found, what actions can we take”?
Enter Performance Analytics
Performance Analytics is an application that collects data from all layers of the stack in your environment, and makes it readily available for study and investigation. By collecting data from OBIEE Usage Tracking, operating system metrics, database sessions, and a myriad of other sources, our application provides administrators with an all-encompassing view of their system. It has never been easier to identify the causes of poor performance.
However, simply identifying a cause of poor performance isn’t all that’s required. In fact, it’s almost useless without knowing how to resolve the issue. Rittman Mead has expertise ranging from databases and data warehouses to front end browser applications, and everything in between. Our team will help you understand the problems discovered by Performance Analytics and show you how to fix them.
With the newest release of Performance Analytics, improving the performance of your BI ecosystem is easier than ever. No longer will your users sit around waiting for reports, no longer will you need to guess at configuration settings, and no longer will you be left with no leads to investigate when users desire a better experience.
New Features
Simple and Lightweight Installation
Performance Analytics is now deployed using Docker, requiring absolutely no software installation on any machine other than the monitoring server.
Upgraded and enhanced software.
The open source technologies included in Performance Analytics have come a long way since its inception, and this release provides their latest and greatest versions, as well as our own improvements that increase performance and reliability.
Alerts and Notifications.
Receive notifications based on failed OBIEE system components, a violated performance threshold, or any other identifiable condition found in your data. Be made aware of adverse performance conditions the instant they occur.
And many more...
Learn More
We will be releasing more exciting news about Performance Analytics over the following weeks, so be sure to subscribe to our blog and newsletter to stay up to date!
Visit our Performance Analytics page here.
To request a demo or ask any questions about Performance Analytics, call or email us:
|
P (US): (888) 631-1410
E (US): info@rittmanmead.com
|
P (UK): +44 (0) 1273 911 268
E (UK): info@rittmanmead.com
|
Common OBIEE Implementation Mistakes That Impact Performance
I've recently performed several assessments to help our clients diagnose and fix their OBIEE performance problems. They often share similar design or implementation issues, and I thought it would be useful to present them here as a handy reference:
Mistake 1: No Software Monitoring
The key to happy users is to know there’s a problem before they do, and even better, fix it before they realise. Availability of comprehensive performance metrics is vital to achieve this goal, and Usage Tracking data represent the natural starting point. When enabled in OBIEE, Usage Tracking collects statistics for each query and is helpful to understand usage patterns across dashboards and users, and to analyse performance trends and diagnose specific issue. Whilst Usage Tracking is generally always enabled and data it generates reviewed regularly, other software metrics are not gathered at all or are not available to the BI team, giving only a partial view of the picture.
In addition to gathering and monitoring Usage Tracking data, we would strongly recommend:
Proper OS monitoring to capture full breadth of OS metrics on both application and database servers including CPU %, Load Average, Memory, Disk I/O, Disk Busy %, Network I/O. Store historic data for trend analysis with appropriate aggregations (so as to not blunt peaks), and near-realtime granular data for interactive performance diagnostics.
OBIEE Dynamic Monitoring Service (DMS) metrics collection. These metrics provide information regarding Oracle Fusion Middleware components' performance, state, and on-going behaviour.
All of these can be done and visualised with Rittman Mead OBIEE Performance Analytics Dashboards. Have a look at these videos to see exactly how the dashboards can help, and get in touch with us to request a demo!
Mistake 2: Randomly Changing Configuration Settings
It’s a common belief, or hope depending on available hardware, among online gamers that by changing configuration settings you can fix any software performance issue. Unfortunately OBIEE is not a game and this is not true! Whilst OBIEE does not provide any Boost Performance switch, the defaults are generally a good starting point, and unnecessary fiddling without good reason should be avoided:
You can introduce additional problems by mistake.
It makes it hard to track what's changed from a default config.
If it fixes the problem, could be coincidence - no actual understanding of the underlying problem without proof of it.
We at Rittman Mead are firm believers in a practical and logical approach to performance analytics and optimisation. Eschewing the drunk man anti-method of ‘tuning’ configuration settings at random, we advocate making a clear diagnosis and baseline of performance problems before changing anything. Once a clear understanding of the situation is established, steps are taken in a controlled manner to implement and validate one change at a time.
Mistake 3: Data Transformation at Query Time
You can usually find a lot of data transformation being done in the RPD itself. This is one of the most useful functionality of OBIEE, since data re-modelling in-flight at query time is usually a lot quicker to implement rather than changing the underlying data model and / or ETL processes.
Wrangling data this way in a small number of instances is common, but widespread use is indicative of a data model and / or ETL design that needs modifying to take into account the report requirements, it's difficult to maintain, and it results in less efficient SQL, as well as unnecessary complex SQL.
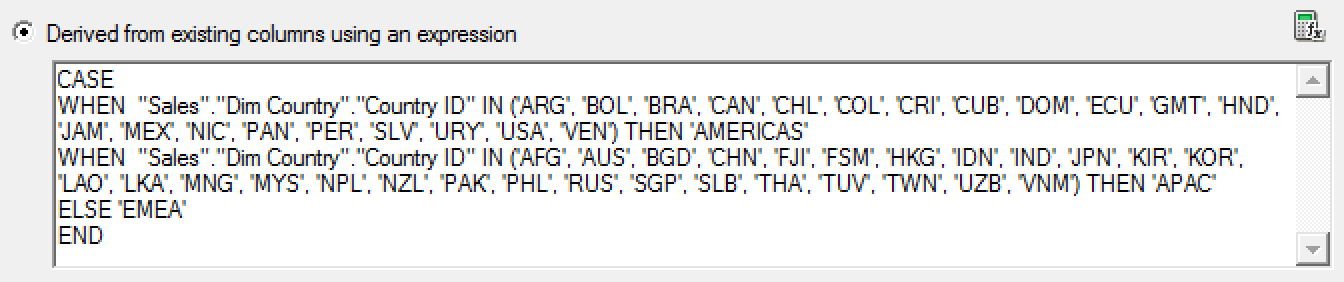
Conditional transformation - Business is always changing and it may require to group data in a way that was not expected when data model has been designed. For example, you can create a logical column using CASE WHEN statement to define a new country grouping which is not present in your data model.
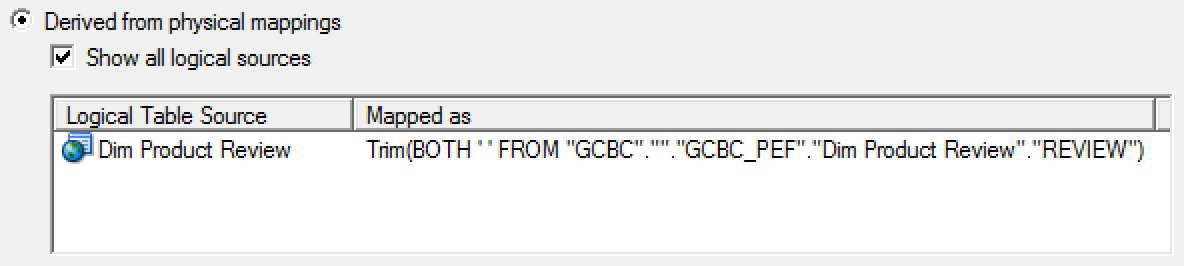
Data cleansing - Sometimes you may need to integrate social networks data into your corporate reports, but you have limited or no control over these contents. For example, you can use the TRIM function to deal with blanks that are expected in a column containing users' reviews for your products.
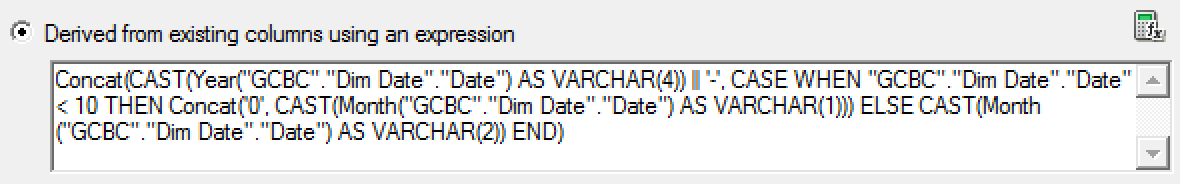
Data conversion - The classic use case for data conversion is when you have to manipulate dates to provide the required format. For example, you can use CAST and Calendar/Date functions to create the format YYYY-MM, required to define the Month level's key of your Date hierarchy, from a date column.
Opaque views - An opaque view is a physical layer table that consists of a SELECT statement. The typical use case for opaque views is when you have to turn a transactional data model into a star schema. However opaque views mask the true data structure from OBIEE, preventing it from best generating optimal data access queries, and they should be used only when there are no other available solutions.
We recommend to do this kind of transformations once, at ETL time, rather than every time a particular table or column is used in a query.
Mistake 4: Underuse of Double Column Feature
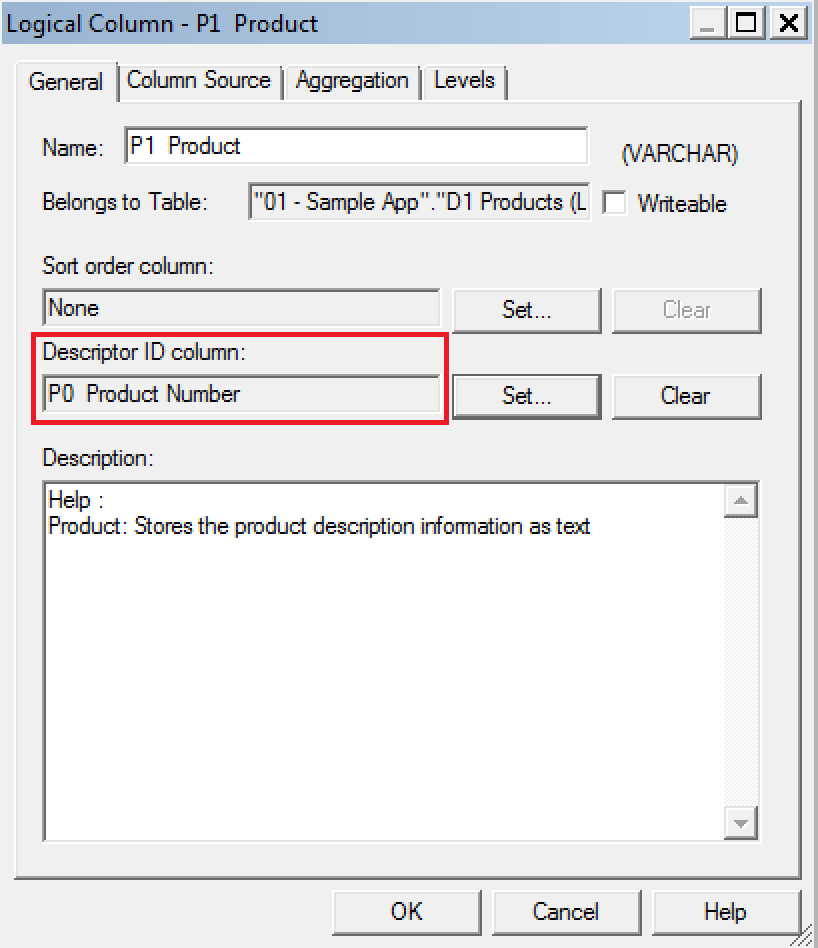
Double Column is probably one of the most undervalued and unused features of OBIEE. It provides a mechanism for associating two logical columns: one column provides the display and description values such as the description of an item; the second column provides a descriptor ID or code column.
Use should be made of the Double Column feature to enable OBIEE to generate more efficient database physical SQL. The principle behind this is that instead of queries running using string-based predicates which may not be indexed in the database or could be less efficient, the user sees the string version of an attribute whilst OBIEE uses the corresponding numerical ID column in the generated query when it queries the database, thus generally creating more optimal execution plans.
As an example, to do this we start with assigning the P0 Product Number column as the descriptor ID column in the Business Model and Mapping layer for P1 Product column:
Let's now create a simple report in Answers containing T05 Per Name Year and 1- Revenue columns, and apply a filter on P1 Product as well. If you are selecting is equal to / is in, is not equal to / is not in or is between operators, then filtering by code values checkbox will be available:
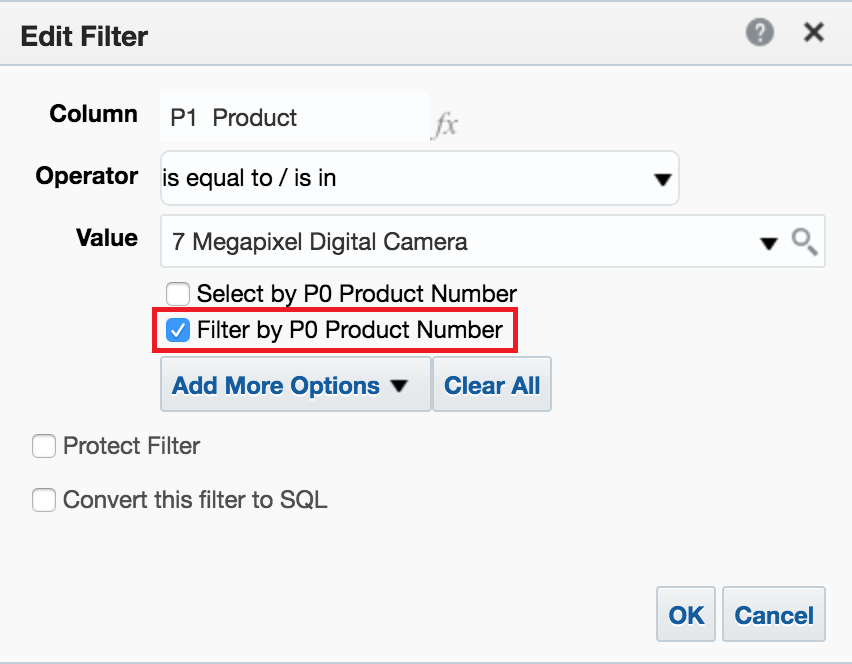
Let's check it, and then see, in terms of SQL, how the query filter is generated:
select sum(T216.Revenue) as c1,
     T795.PER_NAME_YEAR as c2
from
     BISAMPLE.SAMP_PRODUCTS_D T451 /* D10 Product (Dynamic Table) */ ,
     BISAMPLE.SAMP_TIME_QTR_D T795 /* D03 Time Quarter Grain */ ,
     BISAMPLE.SAMP_REVENUE_FA2 T216 /* F21 Rev. (Aggregate 2) */
where  ( T216.Prod_Key = T451.Prod_Key
         and T216.Prod_Key = 7
         and T216.Bill_Qtr_Key = T795.QTR_KEY
         and T451.Prod_Key = 7 )
group by T795.PER_NAME_YEAR
Double Column feature can also be used to define language independent filters as my former colleague Venkat already noted in another post.
Mistake 5: Suboptimal Report Design
Certain suboptimal report designs that I've seen recently include overcrowded analyses, abuse of table / pivot prompts, and OBIEE used as a data extraction tool.
Overcrowded analyses / Overuse of the Excluded area in Views
An overcrowded analysis is an analysis with an awful lot of columns included in Criteria tab and several different views with many excluded columns. These views can then be displayed all together or spread out different dashboard pages.
This pattern is quite common with clients that migrated from Hyperion Interactive Reporting and the main motivation for it - there is only one analysis to maintain - may sound good. However, since Oracle BI Server retrieves results for all columns specified in Criteria tab, we recommend to create several analyses with a single view rather than adopt this pattern. In this way the BI Server generates more efficient queries and avoids on the fly data aggregation.
As an example, you can use Oracle Sample Application v607 to create and run an analysis with a Line-Bar view as follows. Note the huge number of columns in the Excluded area.
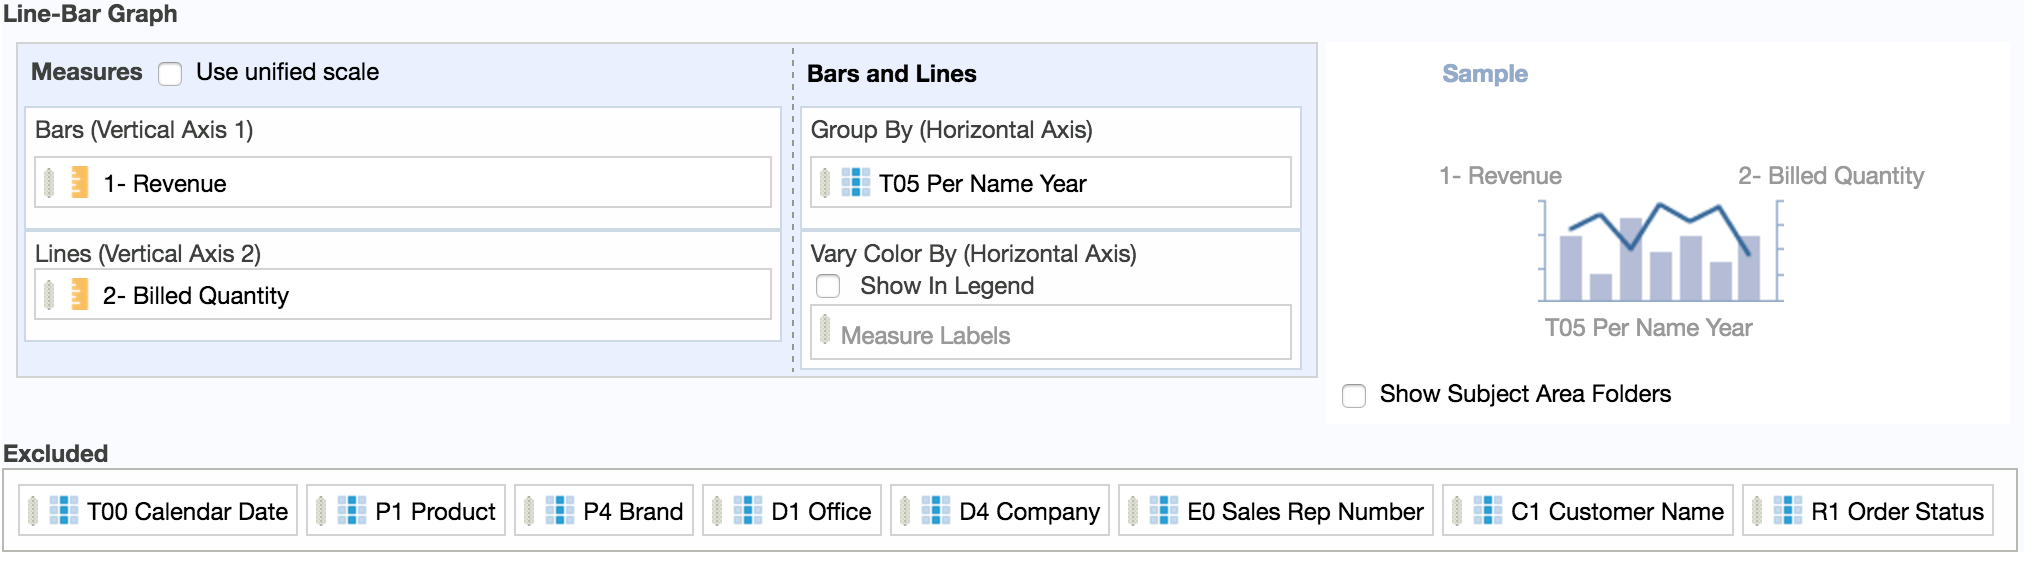
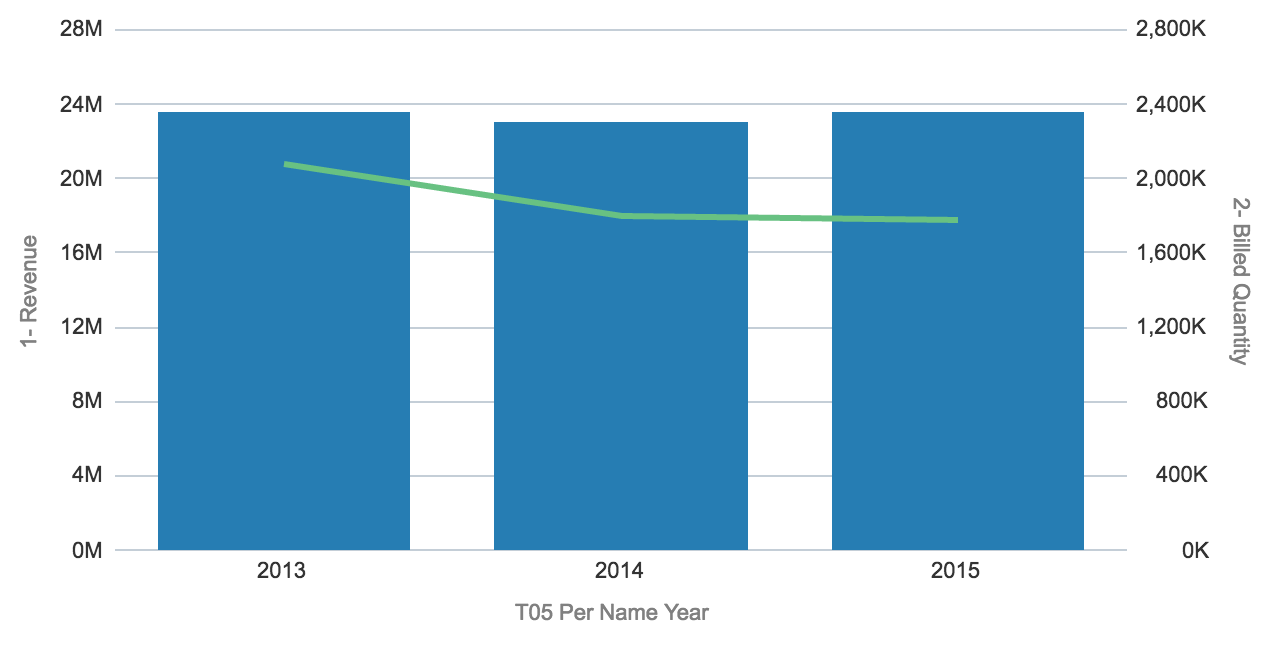
This will results in a simple chart with 3 bars and a line connecting 3 points:
Let's open obis1-query.log log file and have a look at the physical SQL generated by the BI Server:
select sum(T418.Units) as c1,
     sum(T418.Revenue) as c2,
     T762.Name as c3,
     T666.Office_Dsc as c4,
     T666.Company as c5,
     T418.Order_Status as c6,
     T451.Prod_Dsc as c7,
     T451.Brand as c8,
     T437.Employee_Key as c9,
     T42.Calendar_Date as c10,
     T42.Per_Name_Year as c11,
     T666.Office_Key as c12,
     T762.Cust_Key as c13,
     T451.Prod_Key as c14,
     T666.Company_Key as c15
from
     BISAMPLE.SAMP_PRODUCTS_D T451 /* D10 Product (Dynamic Table) */ ,
     BISAMPLE.SAMP_TIME_DAY_D T42 /* D01 Time Day Grain */ ,
     BISAMPLE.SAMP_CUSTOMERS_D T762 /* D60 Customers */ ,
     BISAMPLE.SAMP_OFFICES_D T666 /* D30 Offices */ ,
     BISAMPLE.SAMP_EMPL_D_VH T437 /* D50 Sales Rep (Parent Child Hierarchy) */ ,
     BISAMPLE.SAMP_EMPL_PARENT_CHILD_MAP T490 /* D51 Closure Table Sales Rep Parent Child */ ,
     BISAMPLE.SAMP_REVENUE_F T418 /* F10 Billed Rev */
where  ( T42.Calendar_Date = T418.Bill_Day_Dt and T418.Cust_Key = T762.Cust_Key and T418.Prod_Key = T451.Prod_Key and T418.Empl_Key = T490.Member_Key and T418.Office_Key = T666.Office_Key and T437.Employee_Key = T490.Ancestor_Key )
group by T42.Calendar_Date, T42.Per_Name_Year, T418.Order_Status, T437.Employee_Key, T451.Prod_Key, T451.Prod_Dsc, T451.Brand, T666.Company_Key, T666.Office_Dsc, T666.Company, T666.Office_Key, T762.Name, T762.Cust_Key)
The physical SQL code doesn't look as simple as the resulting view! But the worst is yet to come: it will take about 7 seconds to complete and 256k rows (1.5 GB) will be retrieved from the database!
Let's remove all the excluded columns from the analysis and see what happens to the physical SQL:
select sum(T216.Units) as c1,
     sum(T216.Revenue) as c2,
     T795.PER_NAME_YEAR as c3
from
     BISAMPLE.SAMP_TIME_QTR_D T795 /* D03 Time Quarter Grain */ ,
     BISAMPLE.SAMP_REVENUE_FA2 T216 /* F21 Rev. (Aggregate 2) */
where  ( T216.Bill_Qtr_Key = T795.QTR_KEY )
group by T795.PER_NAME_YEAR
Definitely far better than it looked before. Moreover it will take about 0.2 seconds - 97% less - to complete and only 3 rows (3 KB) - 99% less - will be retrieved from the database.
Abuse of Table / Pivot prompts
Table / Pivot prompts provides an interactive result set that enables users to select the data that they want to view. However Table prompts doesn’t apply any WHERE condition to the query issued by the BI Server: it will retrieve the full result set first, and then select the data to display on the fly. For this reason we recommend to use Dashboard prompts rather than Table / Pivot prompts.
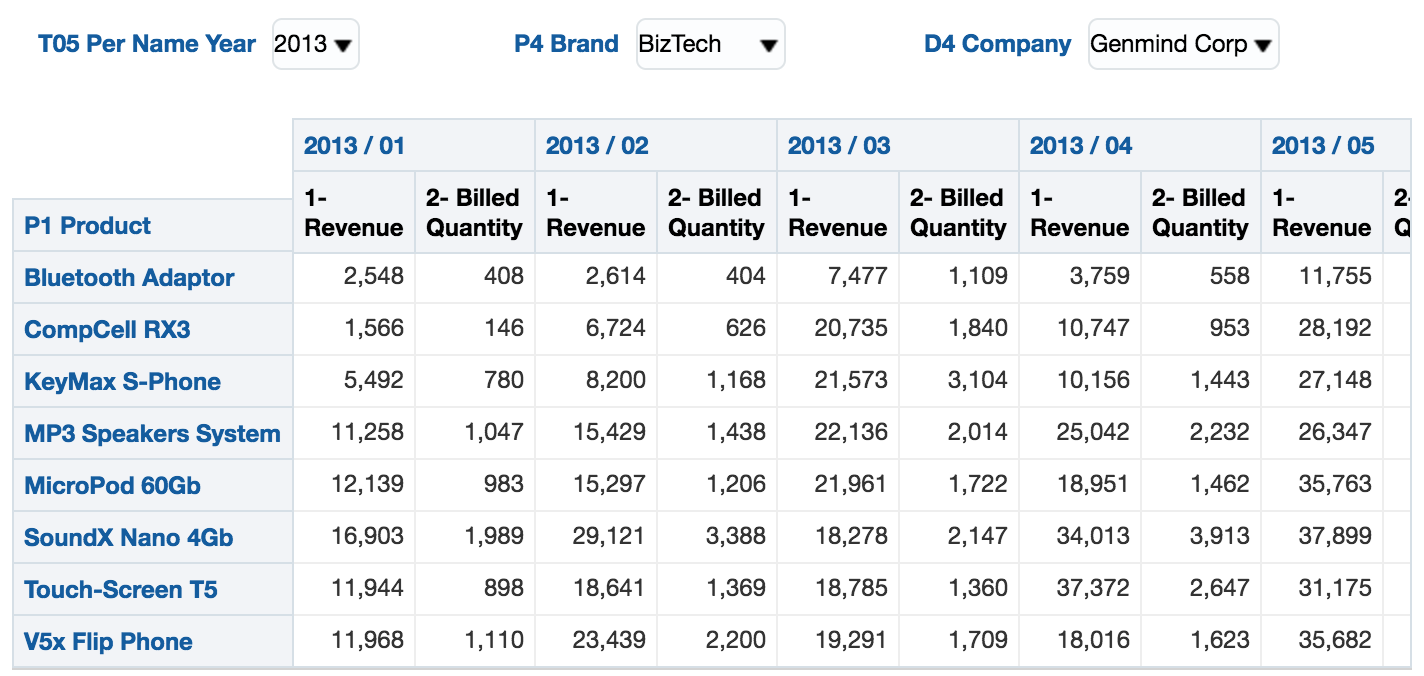
As an example, you can create and run an analysis with a Pivot Table view as follow:
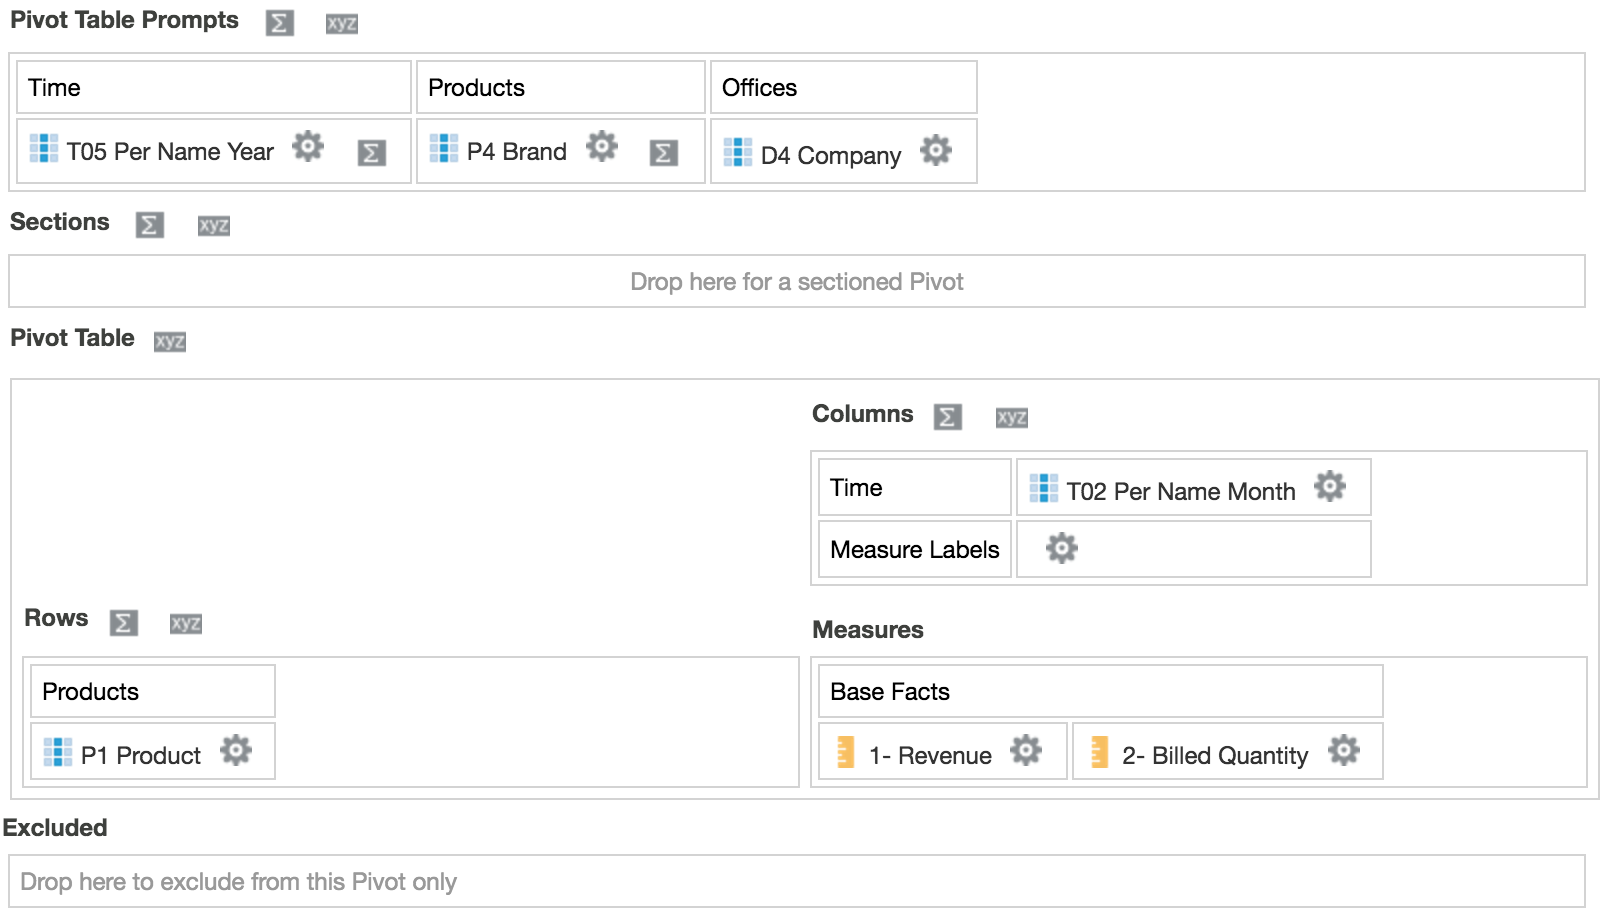
This will results in a pivot table with 8 rows and 25 columns:
Again, let's open obis1-query.log log file and have a look at the physical SQL generated by the BI Server:
select sum(T418.Units) as c1,
     sum(T418.Revenue) as c2,
     T666.Company as c3,
     T451.Prod_Dsc as c4,
     T451.Brand as c5,
     T653.Per_Name_Month as c6,
     T653.Per_Name_Year as c7,
     T666.Company_Key as c8,
     T451.Prod_Key as c9
from
     BISAMPLE.SAMP_PRODUCTS_D T451 /* D10 Product (Dynamic Table) */ ,
     BISAMPLE.SAMP_TIME_MTH_D T653 /* D02 Time Month Grain */ ,
     BISAMPLE.SAMP_OFFICES_D T666 /* D30 Offices */ ,
     BISAMPLE.SAMP_REVENUE_F T418 /* F10 Billed Rev */
where  ( T418.Prod_Key = T451.Prod_Key and T418.Bill_Mth_Key = T653.Mth_Key and T418.Office_Key = T666.Office_Key )
group by T451.Prod_Key, T451.Prod_Dsc, T451.Brand, T653.Per_Name_Year, T653.Per_Name_Month, T666.Company_Key, T666.Company
As expected no WHERE condition based on selected values in pivot prompts was applied to the query. It will take about 0.3 seconds to complete and 2k rows (10 MB) will be retrieved from the database.
Now let's replace pivot prompts with dashboard prompts and see what happens to the physical SQL:
select sum(T418.Units) as c1,
     sum(T418.Revenue) as c2,
     T451.Prod_Dsc as c3,
     T653.Per_Name_Month as c4,
     T451.Prod_Key as c5
from
     BISAMPLE.SAMP_PRODUCTS_D T451 /* D10 Product (Dynamic Table) */ ,
     BISAMPLE.SAMP_TIME_MTH_D T653 /* D02 Time Month Grain */ ,
     BISAMPLE.SAMP_OFFICES_D T666 /* D30 Offices */ ,
     BISAMPLE.SAMP_REVENUE_F T418 /* F10 Billed Rev */
where  ( T418.Prod_Key = T451.Prod_Key and T418.Bill_Mth_Key = T653.Mth_Key and T418.Office_Key = T666.Office_Key and T451.Brand = 'BizTech' and T653.Per_Name_Year = '2013' and T666.Company = 'Genmind Corp' )
group by T451.Prod_Key, T451.Prod_Dsc, T653.Per_Name_Month
It looks better than before, huh? The optimised code will take about 0.1 seconds - 67% less - to complete and 96 rows (0.2 MB) - 95% less - will be retrieved from the database.
OBIEE as a data extraction tool
A large number of clients are using OBIEE mostly as a feed for Excel-marts. Using OBIEE simply as a data extraction tool for lots of data into Excel or other destinations can cause both performance and functional problems. OBIEE is designed to be primarily used as a reporting and analytics tool, with users interacting with the data within OBIEE and, as my colleague Francesco Tisiot already noted in another post, almost any transformation doable in Excel can be achieved in OBIEE, probably faster and with zero impact on local workstations.
This behaviour could highlight a lack of end user training and / or communication between them and BI developers. End users may don't know OBIEE at all, but are used to working with Excel: at the end of the day people just want their job done as painlessly as possible. We recommend to talk to your end users about what they're doing with the data in their destination system, and whether the same can be achieved within OBIEE. If users really do just need the data in Excel, then you should look at how best to do it (Oracle Doc ID 1558070.1).
Conclusion
I've shown here some of the pitfalls that are commonly made with OBIEE. They can impact the performance for end-users, as well as making life more difficult for those building and maintaining the reports.
If you'd like Rittman Mead to take a look at your OBIEE implementation and make sure you're getting the best out of it, please do get in touch!
POUG
I've just attended my first user group in Poland, the very-excellent POUG. This was the first international version of the conference, having been run previously just within Poland. Based on these two days, I would say it was a resounding success! There was a great atmosphere there, really engaged and enthusiastic. The size of the event, friendliness, and fun made it a very welcoming one, and reminded me a lot of my first ever conference that I attended (back in 2010!), the Rittman Mead BI Forum.
I travelled out to Warsaw on the Thursday, and attended the speakers dinner. It's always nice to see familiar faces and meet new ones - as well as enjoy some jolly good food. The next morning I went for a run at the nearby park, enjoying the sunrise over the water
Good morning Warsaw! #POUG https://t.co/aHAuYonlhE pic.twitter.com/LYgU50bIei
— Robin Moffatt (@rmoff) October 7, 2016
The conference had two tracks, focussing primarily on the database but with some BI content too, as well a talk about property graphs. The first session I attended was also one of my favourites. It was "DBA, Heal Thyself: Five Diseases of IT Organizations and How to Cure Them", presented with great humour and energy by Jim Czuprynski. Some of the uncomfortable truths about mistakes made in the field of IT were laid bare, with no prisoners taken! Whilst it was based on the database, much of it was applicable to OBIEE. Things like reliance on bespoke scripts, avoidance of new features, and general ignorance in the field were covered. You can find an article on the topic from Jim here.
After Jim's session was Hans Viehmann talking about Property Graphs. I wrote an article that was published on OTN just last week about this and it was great to get chance to meet Hans, and hear him speak.
I skipped the next session to do a bit of slide polishing and geek chat with Christian Berg, before getting lunch - which was really good:
Just a light lunch at #POUG pic.twitter.com/B3Bntf1JCU
— Robin Moffatt (@rmoff) October 7, 2016
After lunch was OBIEE presentations in both tracks, by Christian Berg, and Kiran Taylor. I sat in on Christian's "Fifty shades of #fail", which is a fun walk through some of the many ways that OBIEE gets done wrong.
My talk, "(Still) No Silver Bullets - OBIEE 12c Performance in the Real World" was the last of the day. I've given this talk quite a few times now, but still enjoy delivering it each time. The topic's one I've spent so much time working on and find so interesting, that it never gets stale! You can find the slides here and set of related links here.
.@rmoff - OBIEE performance in the real world - where is it slow? - #POUG pic.twitter.com/IanRoHBX2G
— Kiran Tailor (@KiranTailorUK) October 7, 2016
The day finished with the POUG After Party, which was at a bar in the center of Warsaw. Good beer, good food, good music - and plenty of geek talk! I really have to take my hat off to the organisers of POUG, they did a great job.
#POUG #bagpipes pic.twitter.com/ZC8WGwq8Z6
— Robin Moffatt (@rmoff) October 7, 2016
The second day of POUG brought more good presentations. I got to see Neil Chandler speak, about execution plans and how they can vary - and how to ensure they don't unless you want them too. It was really interesting, and took me back a few years to when I last looked in-depth at this kind of stuff. After Neil was Jim again, talking about analytic functions. Most of these I knew about, but one that was new to me (and I'll definitely be using) was the PERCENT syntax for FETCH FIRST - very neat.
Great stuff from @JimTheWhyGuy at #POUG. FETCH FIRST I knew… but now I know you can use PERCENT with it too. Cool! pic.twitter.com/f10yoz8yge
— Robin Moffatt (@rmoff) October 8, 2016
The audience at POUG seemed to be predominantly DBAs and database developers, and this kind of talk is just great for spreading awareness of new functionality that is going to make people's jobs easier, and their code run faster. The final talk of the morning was from Martin Widlake, presenting a great discussion about efficient and maintainable bulk processing with SQL and PL/SQL. With his very accessible and engaging presentation style, Martin's talk was an extremely pragmatic and valuable one. Everyone loves a deep-dive geekout on system internals (don't they??), but arguably the most value to the widest section of the audience comes in learning, or being reminded of, how to code and design systems well.
Even without lots of BI content, I found the conference very useful. Whilst Oracle CBO internals may not be my day to day work, many of the topics discussed in a database context can easily be transplanted to the BI world. Performance is performance. Diagnostic approaches are tool-agnostic. As well as the presentations, the opportunity to exchange ideas and war-stories with other experts in the industry (over a beer, usually…) is the kind of thing you just don't get from reading the manuals or a bunch of PDFs.
So that was POUG, and all too soon time return home. Bravo to the organisers of POUG, and here's hoping they run the conference again next year!
Well that was it for #poug. So long @POUG_ORG and thanks for all the fish! pic.twitter.com/mv9Es95yfr
— Christian Berg (@Nephentur) October 8, 2016
All You Ever Wanted to Know About OBIEE Performance…but were too afraid to ask
At the Polish Oracle Users Group (POUG) conference this week I'm presenting one of my favourite talks, [Still] No Silver Bullets - OBIEE Performance in the Real World. This presentation is based on the shared experiences of myself and my Rittman Mead colleagues helping our clients diagnose and - most importantly! - fix their OBIEE performance problems. Performance is something that's interested me for a long time, and my very first conference presentation back in 2010 was on how to test OBIEE performance. Since then I've written and collected a lot of material on the subject, which I thought would be useful to present here as a handy one-stop reference.
OBIEE Performance - testing and optimisation
This series of blog posts goes into great detail on the specifics of testing, and diagnosing, OBIEE performance. Topics such as how to define an "OBIEE report" are covered in depth, along with a discussion of the tools available to carry out performance testing of OBIEE and monitor the results. There's also a whole post on optimisation (frequently called 'tuning') and a hefty rant against some of the common anti-patterns that we see adopted when it comes to troubleshooting poor performance.
Caching
If you ever encounter the unqualified advice "To fix your OBIEE performance problems, enable BI Server caching", then run!
BI Server caching can be brilliant for providing the "icing on the cake" of a well-built system, giving that extra little performance boost. Where BI Server caching is a bad idea is when it is used to "paper over the cracks" of a fundamentally poorly-built OBIEE system. If the foundations are rotten, gold-plating the building on top is not going to do anything to improve things in the long run. If your OBIEE performance is bad, you need to get to the bottom of why and then rectify it. Using caching to mask it only "brushes the problem under the carpet", storing up the same problem or worse for the future as your system usage increases.
With that caveat made, here are two articles that explain how to best use BI Server caching:
You can also watch a "Two-Minute Tech Tip" that I recorded on the subject: Oracle Business Intelligence Server Caching 2MTT
[Still] No Silver Bullets - OBIEE Performance in the Real World
As presented previously at OOW, OUGF, UKOUG, OUG Scotland, and POUG. Newly updated for OBIEE 12c.
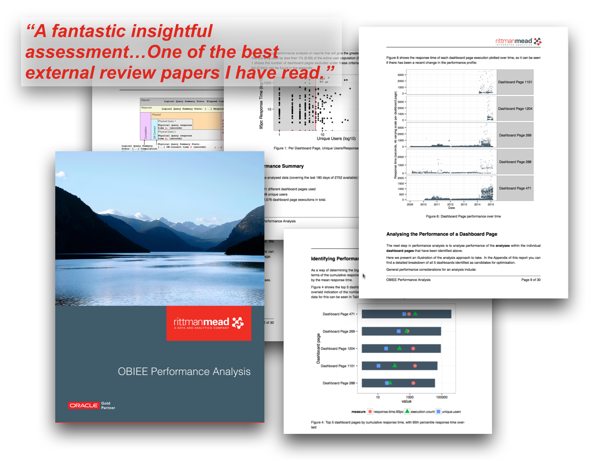
OBIEE Performance Analytics: Analysing the Impact of Suboptimal Report Design
This article has been published on Oracle Technical Network (OTN), and examines in detail what happens when there's sub-optimal design in the implementation of an OBIEE system. Disks fill up, IO bandwidth is exhausted, the server is overworked - and performance suffers.
Performance Analytics Service
The Rittman Mead Performance Analytics Service is the result of our deep understanding of the OBIEE stack, performance optimisation theory, and numerous client engagements. We understand why performance is so crucial to the success of an OBIEE project. We know how OBIEE works, how to diagnose performance issues -- and how to fix them!
Our Performance Analytics Service offers a free baseline Performance Analytics Report for your current OBIEE system, using data to demonstrate where your performance issues lie and prioritising the areas in which to focus investigation. Building on this baseline report, we also offer a detailed Performance Analytics Report. This is prepared by one of our expert OBIEE performance consultants based on deep analysis and understanding of your specific OBIEE implementation and performance pain-points. Not only do we diagnose the specific issues, but we demonstrate the relative effort involved to rectify each one and the expected performance benefit that each will yield.
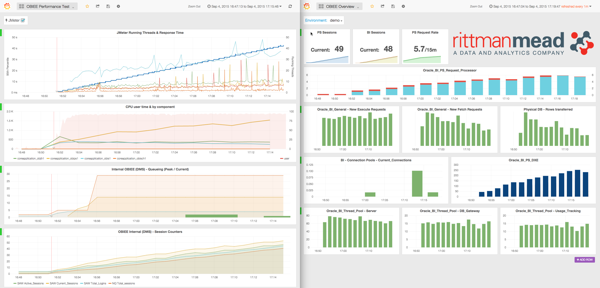
To provide powerful monitoring and diagnostics for the performance of your system we built the OBIEE Performance Analytics Dashboards. These give a full-stack view of the metrics that can impact performance of your OBIEE reports. This gives you the information needed to accurately diagnose issues when they arise, as well as perform historical analysis. Have a look at these videos to see exactly how the dashboards can help, and get in touch with us to request a demo!
(if Youtube is blocked, you can also download them here : 1, 2, 3)
Product Documentation
The documentation for OBIEE includes very useful sections on OBIEE performance that are worth reading:
- OBIEE 11.1.1.9 : Managing Performance Tuning and Query Caching
- OBIEE 12.2.1 : Managing Performance Tuning and Query Caching
Tuning Guide
Oracle has published white papers available through My Oracle Support that detail further options available within the OBIEE stack for tuning performance. In a blog article I do somewhat grumble about these papers and how they can be misused ("oooh here's a knob that I can fiddle with") if taken without proper context and diagnostics. In the right hands, however, they are useful reference for some of the more advanced configuration settings and their impact on performance.
- OBIEE 11g Infrastructure Performance Tuning Guide
- OBIEE12c: Best Practices Guide for Infrastructure Tuning
See also page 13 of this document for good advice on working with exports to Excel from OBIEE: Doc ID 1558070.1
General Performance Resources
OBIEE Performance is nothing particularly fancy. The problems are the same as any other stack; just different components. The standard principles apply, and that is why I'd strongly recommend reading these articles as they give a fantastic background to the world of performance diagnostics and optimisation.
- Cary Millsap - Thinking Clearly About Performance
- Brendan Gregg - The USE method
- Brendan Gregg - Linux Performance Tools (also great discussion of performance troubleshooting methodology)
- Greg Rahn - The Core Performance Fundamentals Of Oracle Data Warehousing – Balanced Hardware Configuration
- Oracle documentation - Oracle® Database 2 Day + Data Warehousing Guide - Balanced Hardware Configuration

