Tag Archives: Cloud
The Types of Databases Powering the Cloud
We recently conducted a survey on cloud adoption, and one of the questions we touched upon was the type of databases powering the cloud. Our respondents leverage a wide range of database technologies for their cloud approaches. Here are the top selections, presented in order of popularity.
1. Microsoft SQL Server
Microsoft SQL Server was the overwhelmingly most popular database selection, with 140 respondents. It is a strong general-purpose relational database that is widely supported across many cloud platforms. You can deploy it on Windows and Linux servers, as well as containers. One of its biggest advantages is being able to query other databases’ data in-place. SQL Server 2019 also added Spark and HDFS support out of the box. You can work with both structured and unstructured data and use your programming language of choice.
2. Oracle
More than 80 respondents use Oracle to power their cloud adoption. This widely used database technology offers a multi-model database management system. It also supports MySQL, NoSQL, and in-memory databases. Oracle offers many types of implementation, as well as deep integration with their other solutions. It’s powerful with significant reliability and commercial support, making it popular among larger organizations and those with particularly demanding workloads.
3. MySQL
MySQL is a general purpose open-source database known for its low total cost of ownership, user-friendliness, and support for scaling OLTP applications. Over 40 respondents use this database for their cloud adoption strategy. Replication features offer high-performance and reliability, while InnoDB integration brings ACID compliance to the table.
4. PostgreSQL
PostgreSQL is another open-source relational database finding itself high on the list, with over 20 respondents. This database has been around for more than 30 years, is ACID compliant, and is known for being extremely reliable. A major advantage of this platform is that it offers a lot of flexibility. You can easily add custom data types, develop custom functionality, integrate add-ons from the active developer community, and it’s all available for free.
5. IBM Db2
IBM Db2 is the choice for 20 respondents. It’s a relational database that leverages artificial intelligence for modern applications. It supports multi-cloud and on-premise deployments, and offers both structured and unstructured data storage. This enterprise-grade database is commonly used in IBM host environments.
6. MongoDB
MongoDB is one of the most commonly used document stores, designed for general purpose use. Organizations of all sizes leverage this platform, and the features support many modern applications. Transactional, operational, and analytical applications are all supported in a single database, and it has significant support among third-party developers.
7. MariaDB
MariaDB is an open-source relational database that is compatible with MySQL and Oracle, offers a column-oriented storage engine, and has JSON support. You can put your transactional, analytical, and hybrid workloads on the same database technology, and use row and column storage as needed for each use case. Deployment options include using it as a relational database, setting it up as a distributed SQL database, or powering a data warehouse with it. You can plug-in different storage engines to optimize each workload.
8. Cassandra
Cassandra is a wide-column store, NoSQL database. It’s designed to support multi-cloud and hybrid cloud environments, with reliable performance, high scalability, and features that power modern applications. Operating this database is intentionally kept simple so the total cost of ownership stays low.
Moving to a Modern Database
At Datavail, we’ve guided hundreds of customers through database modernization and cloud migration and have extensive expertise with all mentioned databases. We’re partners and certified with many database platforms, including Oracle, MongoDB, AWS, and Microsoft.
We can help you bring your databases up to speed with end-to-end service. Learn more about cloud adoption trends by reading our white paper.
The post The Types of Databases Powering the Cloud appeared first on Datavail.
Timestamp Functions and Presentation Variables in Oracle Cloud Analytics
One of the most popular Rittman Mead blog posts over the last 10 years is Timestamps and Presentation Variables. As we are seeing more and more migrations to OAC, we decided to review and revise this post for the latest version of Oracle Cloud Analytics (OAC), 105.4.0-140 as of October 2019. Read more about the latest updates here.
--
One could say that creating a chart is not the most complex task in the world of Business Intelligence but we would argue that creating a meaningful report that perfectly illustrates the message hidden in data and therefore adds value to the management is nowhere close to being easy! A good way to make a report as informative as possible is to use trends and comparison. And to do so, a perfect tool would be the time analysis functions. For example comparing sales in a period of time this year to the same period of time the year before. Or measure the similarity or dissimilarity of sales in different months of the year.
Demo Platform
I have used a free trial instance of OAC for this demo. If you haven’t done yet, sign up for a free 30-day trial Oracle Cloud account (different to an Oracle account). Use the account to access the Oracle Cloud Infrastructure (OCI) console which is the latest Oracle movement towards having one integrated cloud platform to manage all your Oracle cloud applications, platforms, and infrastructure in one place.
From the OCI console it is 5 to 10 minutes before your free trial instance of OAC is up and running. For the detailed step by step of creating a new instance read here.
Demo Goals
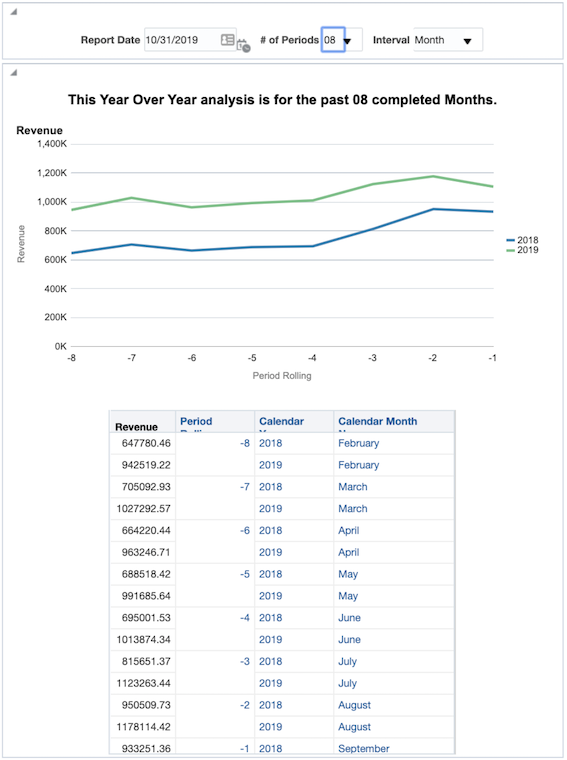
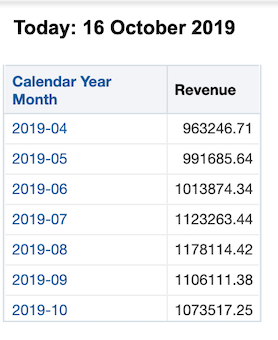
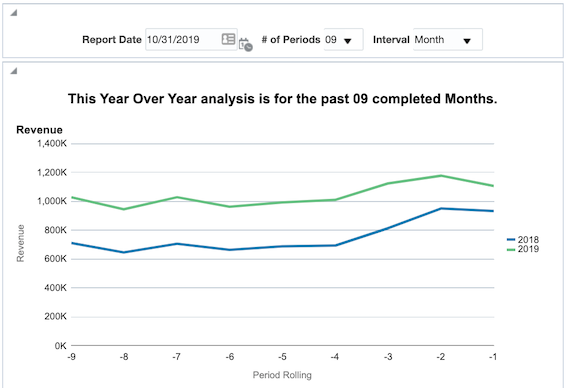
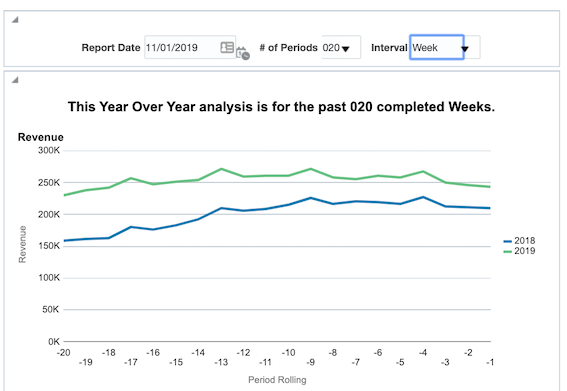
In this blog post I intend to show you how to combine the power of timestamp functions and presentation variables to create robust, repeatable reports. We will create a report that displays a year over year analysis for any rolling number of periods, by week or month, from any date in time, all determined by the user. This entire demo will only use values from a date and a revenue field.
TIMESTAMP Functions
TIMESTAMPADD() manipulates data of the data types DATE and DATETIME based on a calendar year.
Syntax: TIMESTAMPADD(interval, expr, timestamp)
Example: TIMESTAMPADD(SQL_TSI_MONTH, 12,Time."Order Date")
Description: Adds a specified number of intervals to a timestamp, and returns a single timestamp.
Timestamp Interval (TSI) Options: SQL_TSI_SECOND, SQL_TSI_MINUTE, SQL_TSI_HOUR, SQL_TSI_DAY, SQL_TSI_WEEK, SQL_TSI_MONTH, SQL_TSI_QUARTER, SQL_TSI_YEAR
Read more about other calendar functions.
Building Filters
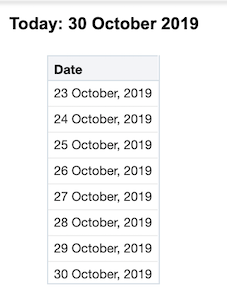
Starting to build our demo, the filter below returns all dates greater than or equal to 7 days ago including the current date.

In other words we have now a functional filter to select all the rows where Date >= a week ago.
As a good practice, always include a second filter giving an upper limit to the time filter. For example "Periods"."Day Date" < CURRENT_DATE would confirm that there won’t be any records that you don’t want in the mix and therefore no unnecessary strain on the system.
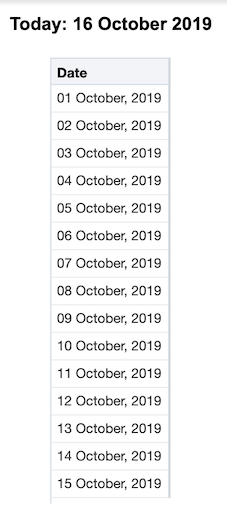
Let’s go one step further, instead of going 7 days back, we could try and include all the previous days in the current month or in other words dates >= the first day of the month. In this scenario, we can use the DAYOFMONTH() function to get the calendar day of any date. From here it will be easy to calculate the number of days in the month so far. Our new filter would look like this:
For example, if today is October 16th, DAYOFMONTH(CURRENT_DATE) would equal 16. Thus, we would subtract 16 days from CURRENT_DATE to go back to September 30th, and adding one will give us October 1st.
Presentation Variables
A presentation variable is a variable that can be created from the front end, the Analytics as part of one of the following types of dashboard prompts:
- Column prompt, Associated with a column and the values that it can take come from the column values. For information on working with column prompts, see Creating a Column Prompt.
- Variable prompt, Not associated with any column, and you define the values that it can take. For information on working with variable prompts, see Creating a Variable Prompt.
Each time a user selects a value in the column or variable prompt, the value of the presentation variable is set to the value that the user selects and will then be sent to any references of that filter throughout the dashboard page. This could be filters, formulas and even text boxes.
The first presentation variable we could introduce is to replace the CURRENT_DATE with a prompted value. Let’s call this presentation variable pv_Date,
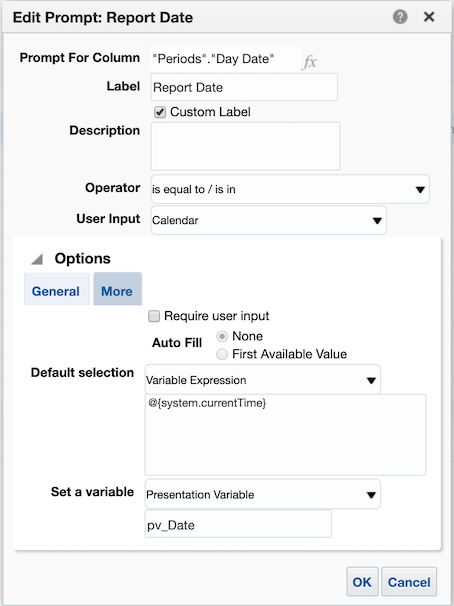
- Use the syntax
@{pv_Date}to call this variable in the reports. - For variables of type string, surround the name in single quotes:
‘@{pv_String]’ - It is good practice to assign a default value to the presentation variables so that you can work with your report before publishing it to a dashboard. For example the default value for the
pv_DateisCURRENT_DATEso the new syntax would be@{pv_Date}{CURRENT_DATE}
Demo Time!
Our updated filter after replacing the CURRENT_DATE looks like below. Will will refer to this filter later as Filter 1 (F1).

The filter is starting to take shape. Now let's say we are going to always be looking at a date range of six months before the selected date. All we would need to do is create a nested TIMESTAMP function. To do this, we will “wrap” our current TIMESTAMP with another that will subtract six months:

Now we have a filter to select dates that are greater than or equal to the first day of the month of any given date and all the six months prior to that.
To take this one step further, we can create another presentation variable called pv_n to allow the users to determine the amount of months to include in this analysis from a dashboard prompt.
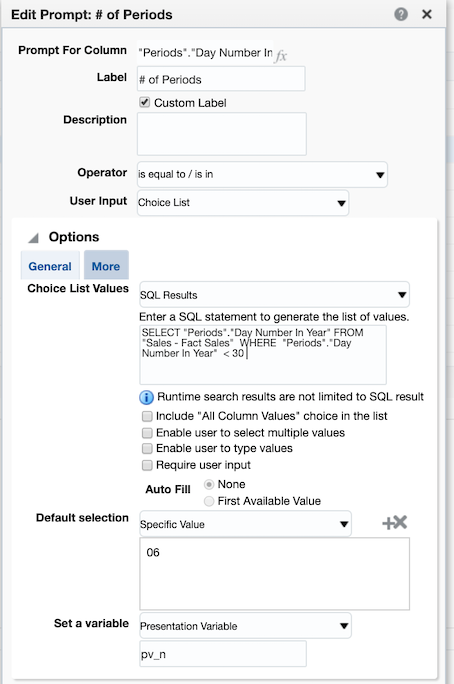
Here is the updated version of our filter using the number of periods presentation variable and a default value of 6, @{pv_n}{6}. We will refer to the following filter as Filter 2 (F2).

Our TIMESTAMPADD function is now fairly robust and will give us any date greater than or equal to the first day of the month from n months ago from any given date. Now we will see what we just created in action by creating date ranges to allow for a Year over Year analysis for any number of months. Consider the following filter set:
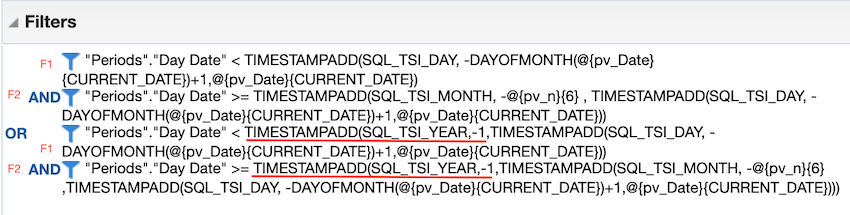
This may appear to be pretty intimidating at first but if we break it into parts we can start to understand its purpose. Notice we are using the exact same filters from before; Filter 1 and Filter 2. What we have done here is filtered on two time periods, separated by the OR statement.
- The first date range defines the period as being the most recent completed n months from any given prompted date value, using a presentation variable with a default of today. Dates in the current month have been removed from the set by Filter 1.
- The second time period, after the OR statement, is the exact same as the first only it has been wrapped in another TIMESTAMP function subtracting a year, giving you the exact same time frame for the year prior.
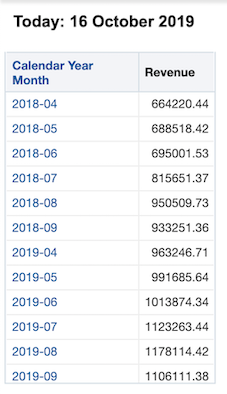
This allows us to create a report that can run a year over year analysis for a rolling n month time frame determined by the user.
A note on nested TIMESTAMPS: you will always want to create nested TIMESTAMPS with the smallest interval first. Then you will wrap intervals as necessary. In this case our smallest increment is day, wrapped by month, wrapped by year.
Let’s Go Crazy
A more advanced trick, If you use real time or near real time reporting: using CURRENT_DATE may be how you want to proceed. Otherwise, instead of using today as your default date value, use yesterday’s date since most data are only as current as yesterday. Using yesterday will be valuable especially when pulling reports on the first day of the month or year - you generally want the entire previous time period rather than the empty beginning of a new one. So, to implement, wherever you have @{pDate}{CURRENT_DATE} replace it with @{pDate}{TIMESTAMPADD(SQL_TSI_DAY,-1,CURRENT_DATE)}
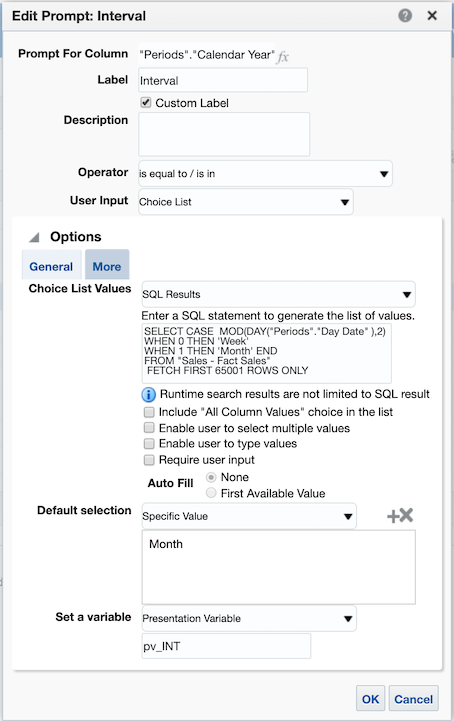
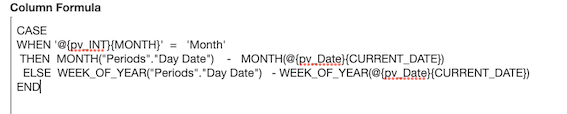
One more change on our filter to make it extra-flexible here is to use a new presentation variable to determine if you want to display year over year values, or by month, or by week. This can be done by inserting a variable into your SQL_TSI_MONTH and DAYOFMONTH statements; changing MONTH to SQL_TSI_@{pv_INT}{MONTH} and DAYOF@{pv_INT}{MONTH}, where pv_INT is the name of our variable.
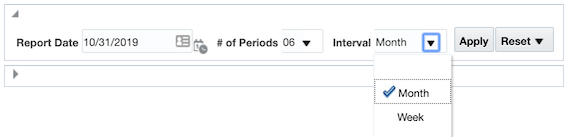
Start by creating a dummy variable in your prompt to allow users to select either MONTH or WEEK. You can try something like this: CASE MOD(DAY("Time"."Date"),2) WHEN 0 'WEEK' WHEN 1 THEN 'MONTH' END
The updated filter now look like this:
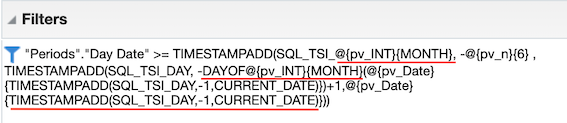
In order for our interaction between Month and Week to run smoothly we have to factor in one last consideration: if we are to take the date December 1st, 2019 and subtract one year we get December 1st, 2018. However, if we take the first day of this week, Sunday December 15, 2019 and subtract one year we get Saturday December 15, 2014. In our analysis this will cause an extra partial week to show up for prior years. To get around this we will add a case statement determining if '@{pv_INT}{MONTH}' = 'Week' THEN subtract 52 weeks from the first of the week ELSE subtract 1 year from the first of the month. With this, our final filter set will look like this:
With the use of these filters and some creative dashboarding, you can construct a report that easily allows you to view a year over year analysis from any date in time for any number of periods either by month or by week.
Filtered by Week intervals;
The formula below will give you the value of period rolling to use in the analysis;
In this post, we created a cloud version of the amazing demo previously described by Brian Hall. As demonstrated, Timestamp functions and their power have been within the interesting topics of the visualisation and reporting for as long as we at Rittman Mead remember and can still be used in the realm of the Oracle Cloud Services in a very similar way as the past.
Feel free to get in touch, let us know your reviews and comments.
Oracle Analytics Cloud (OAC) training with Rittman Mead
Rittman Mead have today launched it's new Oracle Analytics Cloud (OAC) Bootcamp. Run on OAC, the course lasts four days and covers everything you need to know in order to manage your Cloud BI platform and assumes no prior knowledge up-front.
As the course is modular, you are able to choose which days you'd like to attend. Day 1 covers an OAC overview, provisioning, systems management, integration and security. Day 2 covers RPD Modelling and Data Modeller. Day 3 is devoted to creating reports, dashboards, alerts and navigation. Day 4 covers content creation using Oracle Data Visualization.
Book here: https://www.rittmanmead.com/training-schedule/
Got a team to train? You can also have our OAC Bootcamp delivered on-site at your location. For more information and prices contact training@rittmanmead.com
Oracle OpenWorld Europe : London 2019
Some eleven thousand people descended on Oracle OpenWorld Europe in London last week for two days of business and technical sessions delivered by a mixture of members of Oracle’s product team and end users giving real-world case studies of adoption of Oracle’s Cloud offerings and product roadmaps.

Something that may not surprise anyone is that at OpenWorld, to speak of anything other than Cloud or Autonomous would be somewhat blasphemous.
It’s a shrewd move this by Oracle to branch outside of their flagship annual conference held in Redwood Shores in October and the attendance backed up the rationale that offering free entry was the right thing to do.
Some of the observations that I made after attending were:
The future is Autonomous
Oracle’s Autonomous Database offering is being heavily pushed despite being a relatively immature product with very few real-world examples yet. The concept is certainly valid and it’s worth new and existing customers of Oracle seriously considering trialling.
There are two autonomous offerings. The autonomous data warehouse (ADW) and autonomous transaction processing (ATP).
Both are fully cloud managed by Oracle, are elastic so that they can be scaled up and down on demand, and most importantly - are autonomous. So the marketing spiel goes, they are self driving, self securing, self repairing. You’ll see this a lot but basically it means that the manual tasks that a DBA would normally perform are taken care of by Oracle. Think patching etc…
AI & ML
You can tell that Oracle are really getting behind the latest trends in the technology market. AI will be a feature of all of their Cloud applications with Mark Hurd (Oracle CEO) predicting that by 2025 all applications on the market with have AI factored in (fair prediction)
Further more Oracle's 2018 acquisiton of DataScience.com show's the strategic vision of the companies board.
Blockchain
Also picking up on the cyber security side of things, Oracle spoke a lot about the role that Blockchain will play in enterprises going forwards. Oracle’s Blockchain cloud platform offering gives enterprises a rapid and simplified deployment of blockchain networks.
Final Thoughts
In summary, this was a really good event for Oracle to run and I really hope they continue to do so. It gave a chance for the Oracle community to come together again and in a growingly competitive market for Cloud, Oracle needs to keep investing in its community going forwards.
Conceptually Oracle has some very timely cloud offerings in their armoury and it will be interesting to come back in 12 months time and see how the adoption of these applications & platforms is going.
OAC 18.3.3: New Features
I believe there is a hidden strategy behind Oracle's product release schedule: every time I'm either on holidays or in a business trip full of appointments a new version of Oracle Analytics Cloud is published with a huge set of new features!

OAC 18.3.3 went live last week and contains a big set of enhancements, some of which were already described at Kscope18 during the Sunday Symposium. New features are appearing in almost all the areas covered by OAC, from Data Preparation to the main Data Flows, new Visualization types, new security and configuration options and BIP and Essbase enhancements. Let's have a look at what's there!
Data Preparation
A recurring theme in Europe since last year is GDPR, the General Data Protection Regulation which aims at protecting data and privacy of all European citizens. This is very important in our landscape since we "play" with data on daily basis and we should be aware of what data we can use and how.
Luckily for us now OAC helps to address GDPR with the Data Preparation Recommendations step: every time a dataset is added, each column is profiled and a list of recommended transformations is suggested to the user. Please note that Data Preparation Recommendations is only suggesting changes to the dataset, thus can't be considered the global solution to GDPR compliance.
The suggestion may include:
- Complete or partial obfuscation of the data: useful when dealing with security/user sensitive data
- Data Enrichment based on the column data can include:
- Demographical information based on names
- Geographical information based on locations, zip codes
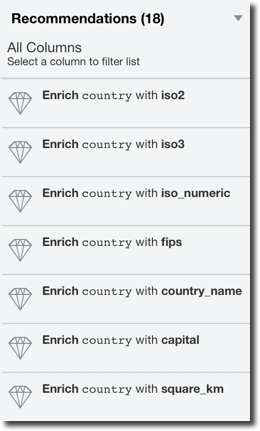
Each of the suggestion applied to the dataset is stored in a data preparation script that can easily be reapplied if the data is updated.
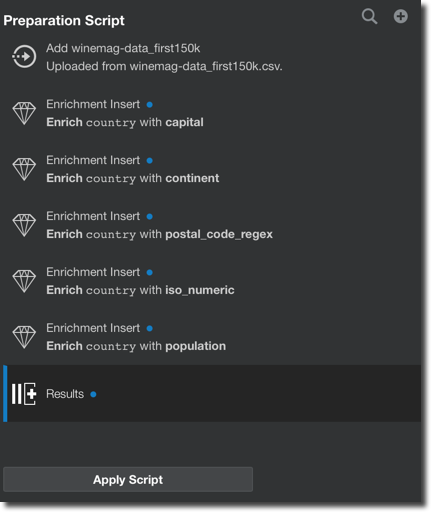
Data Flows
Data Flows is the "mini-ETL" component within OAC which allows transformations, joins, aggregations, filtering, binning, machine learning model training and storing the artifacts either locally or in a database or Essbase cube.
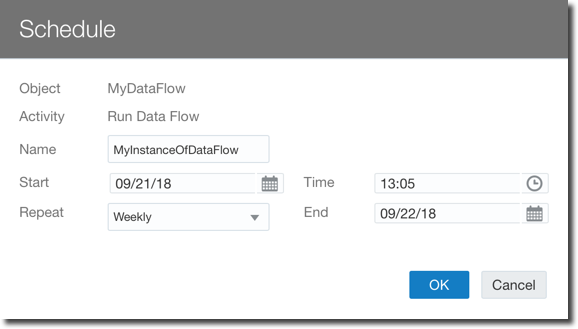
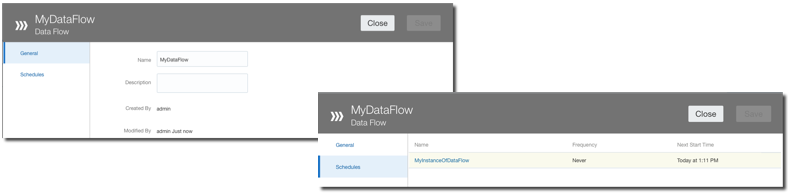
The dataflows however had some limitations, the first one was that they had to be run manually by the user. With OAC 18.3.3 now there is the option to schedule Data Flows more or less like we were used to when scheduling Agents back in OBIEE.
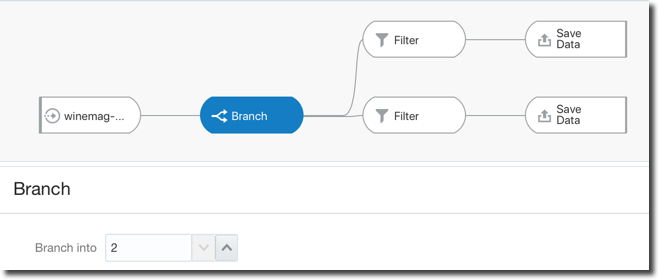
Another limitation was related to the creation of a unique Data-set per Data Flow which has been solved with the introduction of the Branch node which allows a single Data Flow to produce multiple data-sets, very useful when the same set of source data and transformations needs to be used to produce various data-sets.
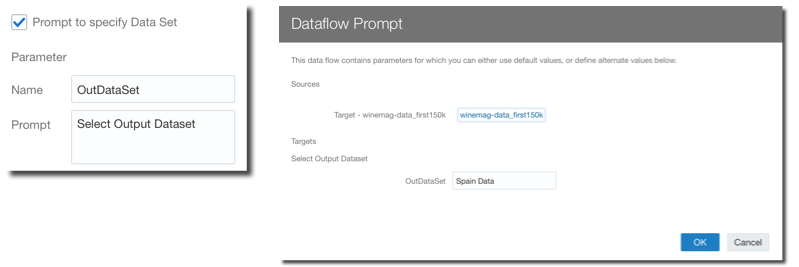
Two other new features have been introduced to make data-flows more reusable: Parametrized Sources and Outputs and Incremental Processing.
The Parametrized Sources and Outputs allows to select the data-flow source or target during runtime, allowing, for example, to create a specific and different dataset for today's load.
The Incremental Processing, as the name says, is a way to run Data Flows only on top of the data added since the last run (Incremental loads in ETL terms). In order to have a data flow working with incremental loads we need to:
- Define in the source dataset which is the key column that can be used to indicate new data (e.g.
CUSTOMER_KEYorORDER_DATE) since the last run - When including the dataset in a Data Flow enable the execution of the Data Flow with only the new data
- In the target dataset define if the Incremental Processing replaces existing data or appends data.
Please note that the Incremental Load is available only when using Database Sources.
Another important improvement is the Function Shipping when Data Flows are used with Big Data Cloud: If the source datasets are coming from BDC and the results are stored in BDC, all the transformations like joining, adding calculation columns and filtering are shipped to BDC as well, meaning there is no additional load happening on OAC for the Data Flow.
Lastly there is a new Properties Inspector feature in Data Flow allowing to check the properties like name and description as well as accessing and modifying the scheduling of the related flow.
Data Replication
Now is possible to use OAC to replicate data from a source system like Oracle's Fusion Apps, Talend or Eloqua directly into Big Data Cloud, Database Cloud or Data Warehouse Cloud. This function is extremely useful since allows decoupling the queries generated by the analytical tools from the source systems.
As expected the user can select which objects to replicate, the filters to apply, the destination tables and columns, and the load type between Full or Incremental.
Project Creation
New visualization capabilities have been added which include:
- Grid HeatMap
- Correlation Matrix
- Discrete Shapes
- 100% Stacked Bars and Area Charts
In the Map views, Multiple Map Layers can now be added as well as Density and Metric based HeatMaps, all on top of new background maps including Baidu and Google.
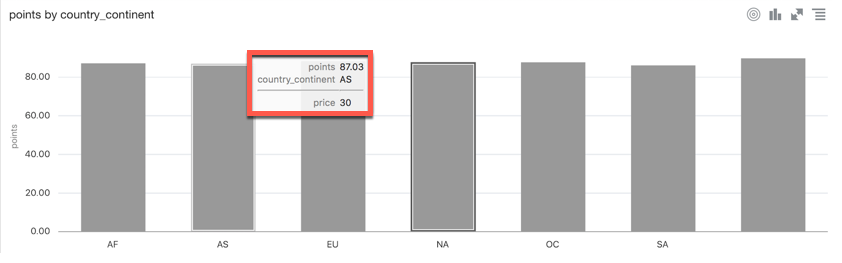
Tooltips are now supported in all visualizations, allowing the end user to add measure columns which will be shown when over a section of any graph.
The Explain feature is now available on metrics and not only on attributes and has been enhanced: a new anomaly detection algorithm identifies anomalies in combinations of columns working in the background in asynchronous mode, allowing the anomalies to be pushed as soon as they are found.
A new feature that many developers will appreciate is the AutoSave: we are all used to autosave when using google docs, the same applies to OAC, a project is saved automatically at every change. Of course this feature can be turn off if necessary.
Another very interesting addition is the Copy Data to Clipboard: with a right click on any graph, an option to save the underline data to clipboard is available. The data can then natively be pasted in Excel.
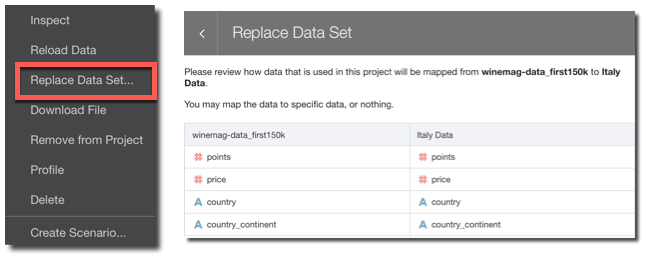
Did you create a new dataset and you want to repoint your existing project to it? Now with Dataset replacement it's just few clicks away: you need only to select the new dataset and re-map all the columns used in your current project!
Data Management
The datasets/dataflows/project methodology is typical of what Gartner defined as Mode 2 analytics: analysis done by a business user whitout any involvement from the IT. The step sometimes missing or hard to be performed in self-service tools is the publishing: once a certain dataset is consistent and ready to be shared, it's rather difficult to open it to a larger audience within the same toolset.
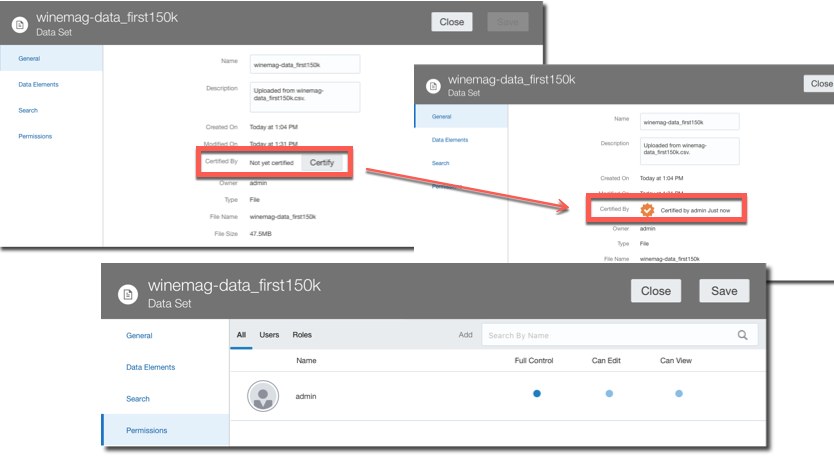
New OAC administrative options have been addressing this problem: a dataset Certification by an administrator allows a certain dataset to be queried via Ask and DayByDay by other users. There is also a dataset Permissions tab allowing the definition of Full Control, Edit or Read Only access at user or role level. This is the way of bringing the self service dataset back to corporate visibility.

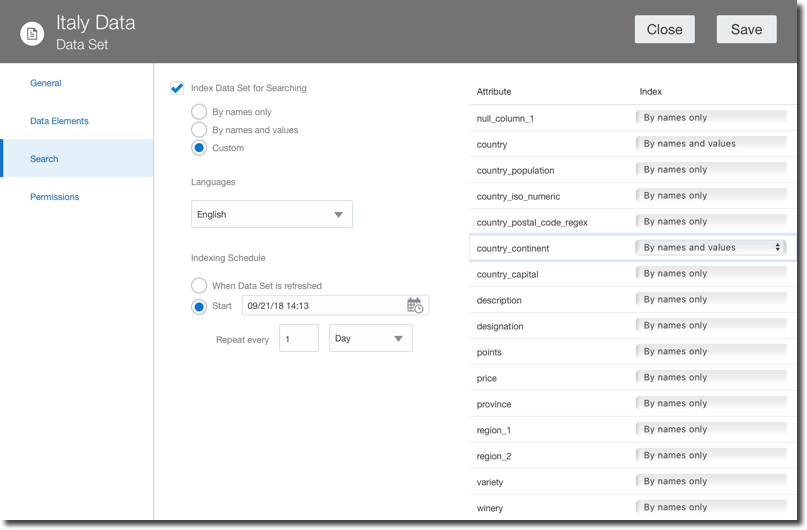
A Search tab allows a fine control over the indexing of a certain dataset used by Ask and DayByDay. There are now options to select when then indexing is executed as well as which columns to index and how (by column name and value or by column name only).
BIP and Essbase
BI Publisher was added to OAC in the previous version, now includes new features like a tighter integration with the datasets which can be used as datasources or features like email delivery read receipt notification and compressed output and password protection that were already available on the on-premises version.
There is also a new set of features for Essbase including new UI, REST APIs, and, very important security wise, all the external communications (like Smartview) are now over HTTPS.
For a detailed list of new features check this link
Conclusion
OAC 18.3.3 includes an incredible amount of new features which enable the whole analytics story: from self-service data discovery to corporate dashboarding and pixel-perfect formatting, all within the same tool and shared security settings. Options like the parametrized and incremental Data Flows allows content reusability and enhance the overall platform performances reducing the load on source systems.
If you are looking into OAC and want to know more don't hesitate to contact us

