Category Archives: Rittman Mead
Oracle Analytics Server is here
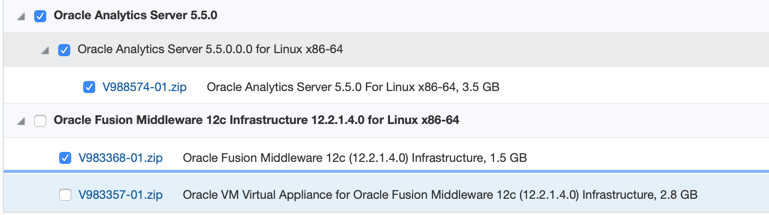
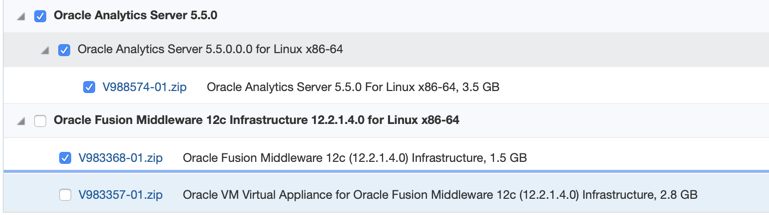
Oracle has been talking about this product for months and we’re pleased to tell you the wait is over (for Linux users anyway), and Oracle Analytics Server (OAS) 5.5.0 is now available for download on edelivery(search Oracle Analytics Server).
If your organisation uses Oracle technology for data analytics, then the likelihood is you’ve heard of Oracle Analytics Cloud (OAC). You may have also come across the latest addition to the family, OAS, the new on-prem version of OAC, set to eventually replace OBIEE.
The umbrella term, Oracle Analytics, now includes:
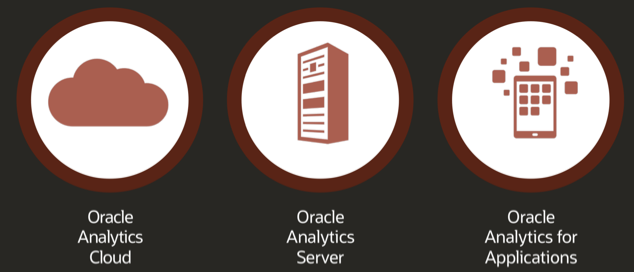
- Oracle Analytics Server (OAS)
- Oracle Analytics Cloud (OAC)
- Oracle Analytics for Applications (OAX)
Whilst OAC is the jewel in the crown, and will receive regular quarterly updates, these updates will be reflected in OAS. You’ll be pleased to hear current OBIEE users will be automatically licensed for OAS - the logic behind this is that OAS becomes a stepping stone in your journey to using Cloud. If you’re buying OAS new, the licensing model is the same as the current OBIEE model.
OAS looks almost the same as OAC, minus some features, like the Natural Language Generator. This feature generates explanations of your visualisations in 28 different languages and will probably be included in a later version of the tool.
How does OAS compare to OBIEE and OAC?
- Licensing: OAS now includes options like Data Visualization (DV) and Mobile which were previously considered extra.
- Data Visualization: Oracle’s self-service visualisation tool does what it says on the tin. Allows you to decipher your enterprise data with intelligent visuals. Now it includes almost all the new features available in OAC. A big step forward compared to the DV version available in the latest OBIEE
- Data Flows: Clean and Transform your data via a GUI based tool without leaving your analytical platform.
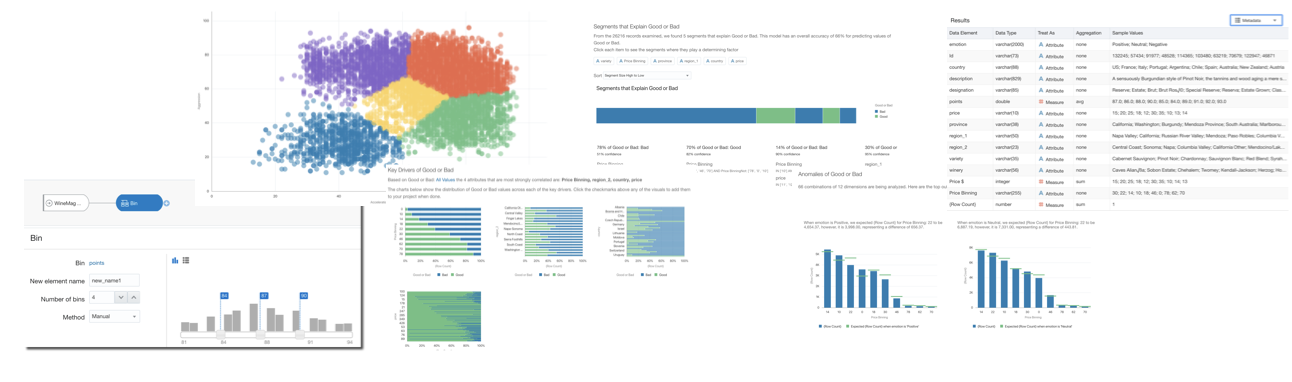
- Machine Learning: All the goodies related to “one-click forecast” or “Explain” and the full ML capabilities are now included in the on-prem Oracle Analytics Edition!
- Configuration Options: OAS provides the "OBIEE"-type configuration options, where you can tweak each componend individually
Oracle’s aim is for users to achieve “100% data literacy” and plan to do this via their vision for analytics: augmented, collaborative and integrated. OAS really plays into this strategy, allowing users to employ data science and machine learning techniques to both analyse current trends and predict future ones (find out more in this blog post)
Talk to us about how to migrate from OBIEE to OAS or OAC. We can help you with every deployment scenario including on-prem, hybrid, full public cloud, or a mix and match of these suited to your needs. Email us: info@rittmanmead.com to arrange a chat with one of our team.
What’s new in OAC5.5?
Last Friday, alongside Oracle Analytics Server (for which a blog post is coming), new OAC version came out, let's have a quick look at all the new features it includes!
Maps
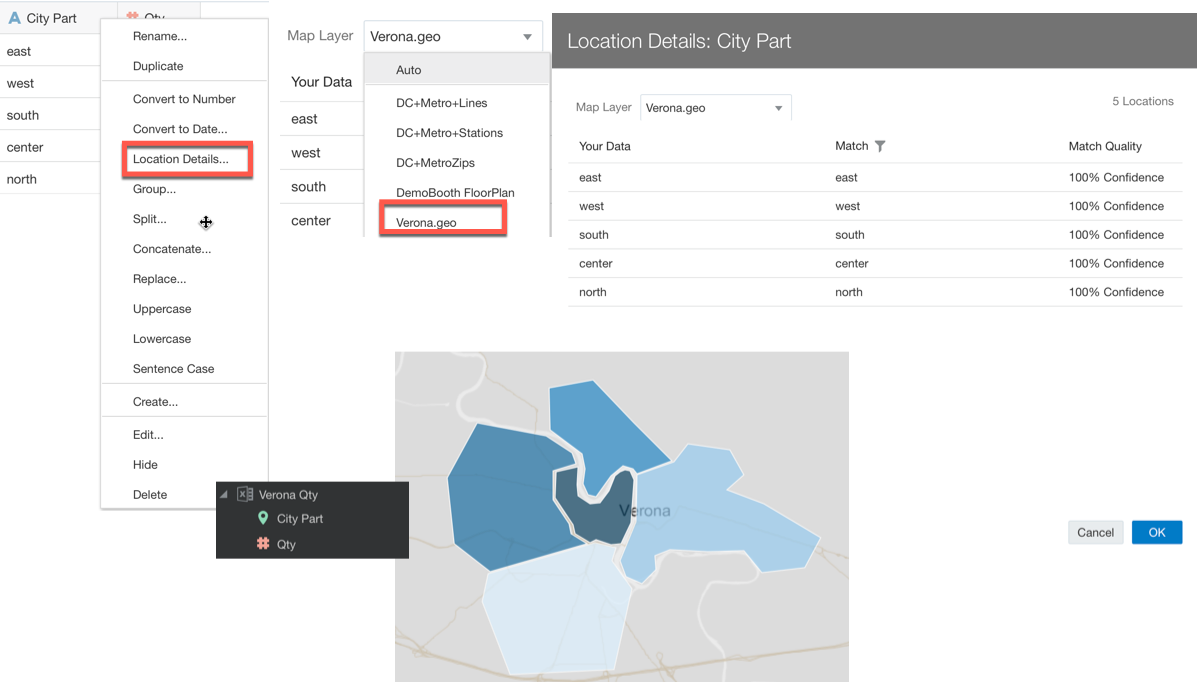
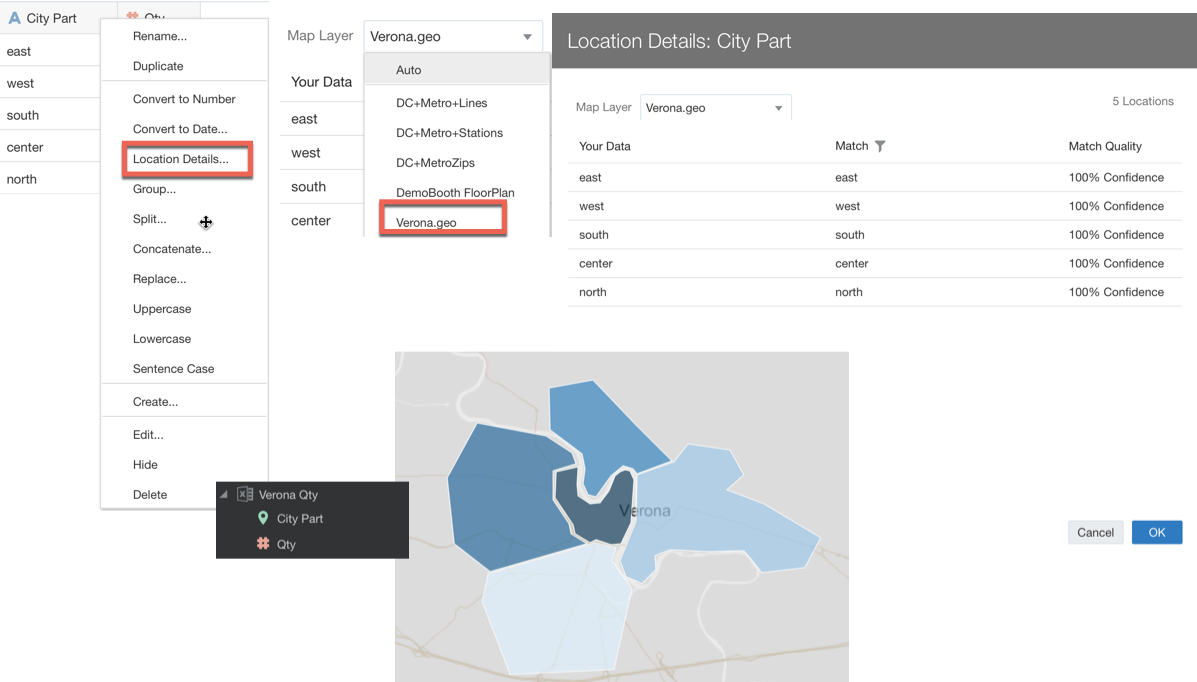
If you use Maps often, then there is a good list of options available to you! The very first is the possibility to associate a Map Layer to a Data Column directly in the data source definition.
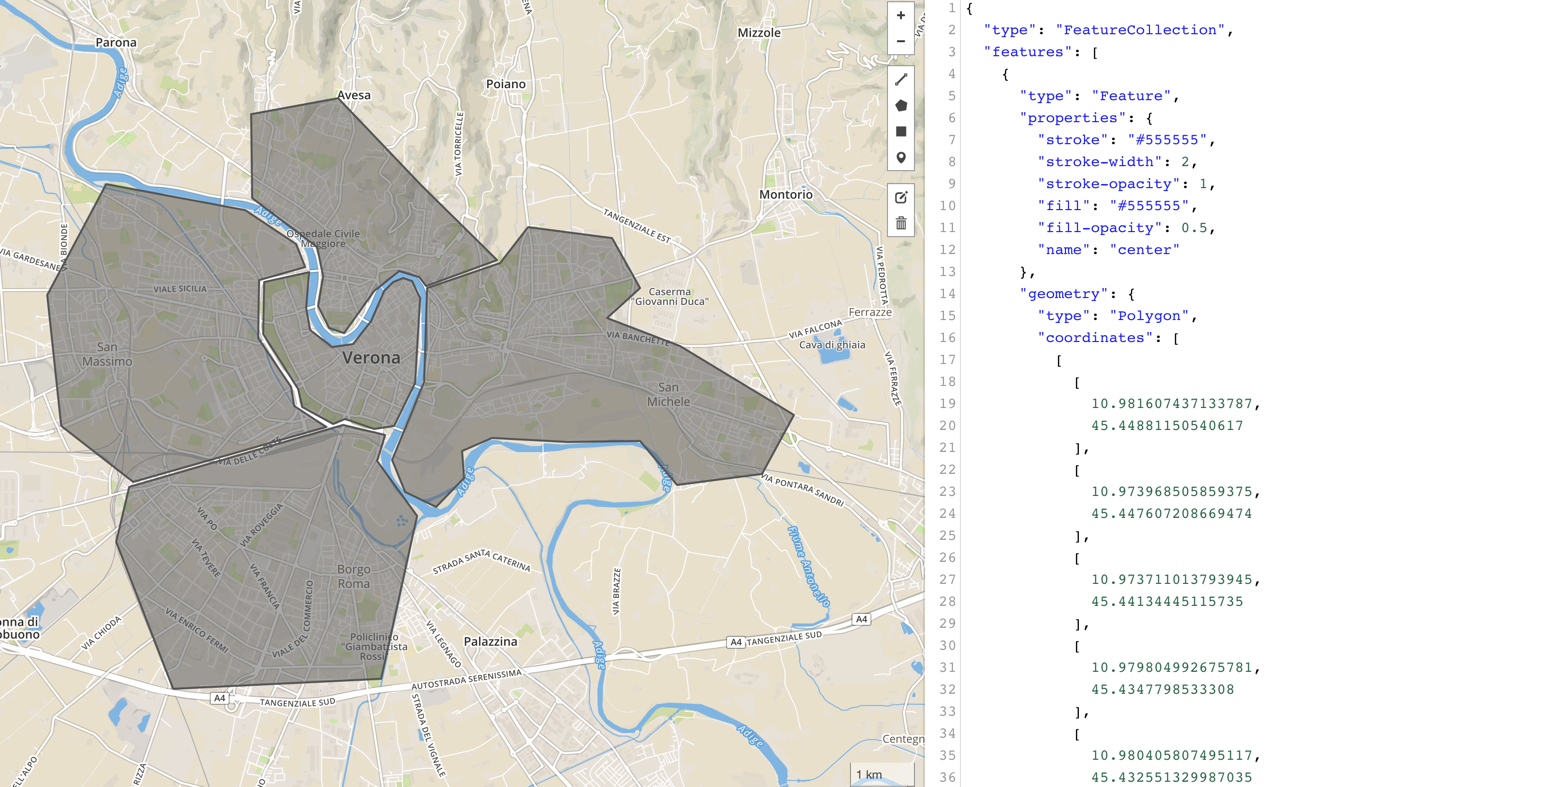
Let's say you have a column City Zones in your dataset, which divides a city in customized areas based on your company needs and you have a map layer defining geographically those areas (e.g. with a GeoJSON file). I created an example with Verona, the city where I live. Custom GeoJSON file was created using geojson.io.
The upload of custom shapes and their usage in OAC was already available since some time, however you as project creator had to associate the City Zone column to the correct Map Layer for each map visualization included in your project. Now you can define the Map Layer to Data column association once for all at datasource level, so every Map using the City Zone column will automatically use the correct Layer.
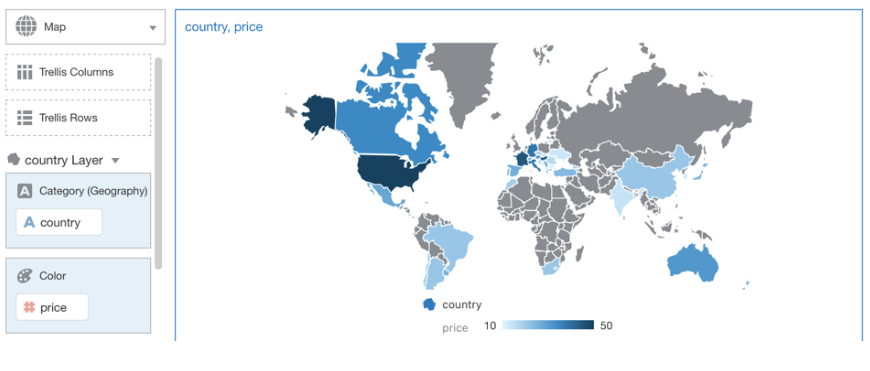
Another cool new feature in Maps is the AutoFocus on Data, meaning that the visualization will automatically zoom and center the map appropriately based on the dataset presented and rearrange in case of changes in the filtering.
Pivot Tables
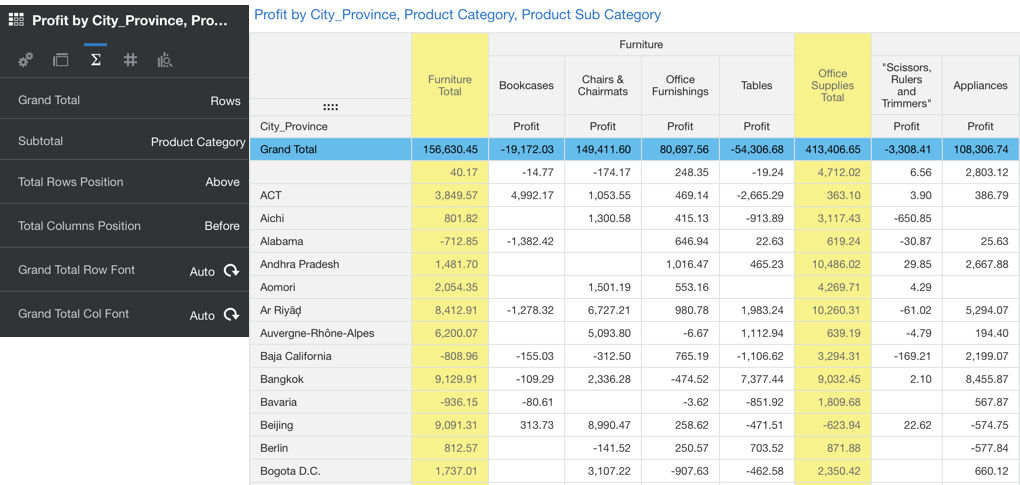
Another new option is available in pivot tables where now you can set Totals and Subtotals Above and Below like you were used to do in Answers. Like the "old" tool you can now set a different format for the Totals and Subtotals with coloring, background and font formatting options available. You have now the full control of the layout and can make beautiful or horrible (like the below) color choices.
Visualizations
The perfect visualization is now available: the Spacer Viz! This is an empty visualization that you can add to your canvas allowing you to optimize the layout in cases where you need an extra white space.
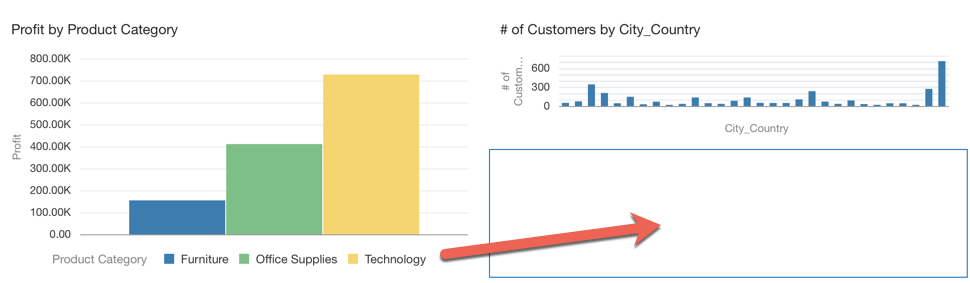
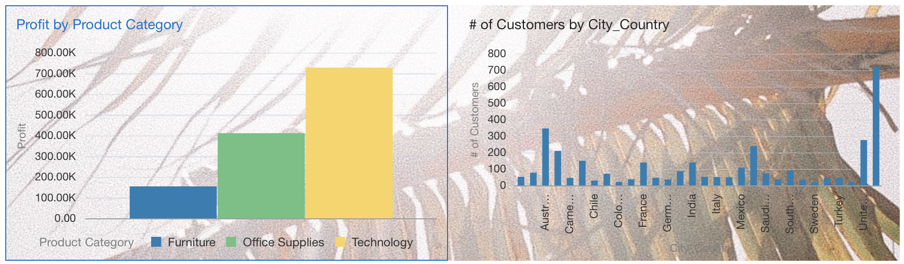
Another news in this release is related to the Custom Background: now it's possible to define a color or an image as background for the whole Project or for a single canvas. The image can be a URL reference or uploaded from the desktop. There are also options to position the image in the screen and to auto-fit the image in the window size. Adding a custom background to the whole project means that every time a new canvas is added, it will already have the selected image/color by default.
Another news is represented by the Butterfly Viz, this view was already available as plugin from the Oracle Analytics Library, now becomes native in OAC5.5. The butterfly viz is useful when comparing two metrics across the same dimension.
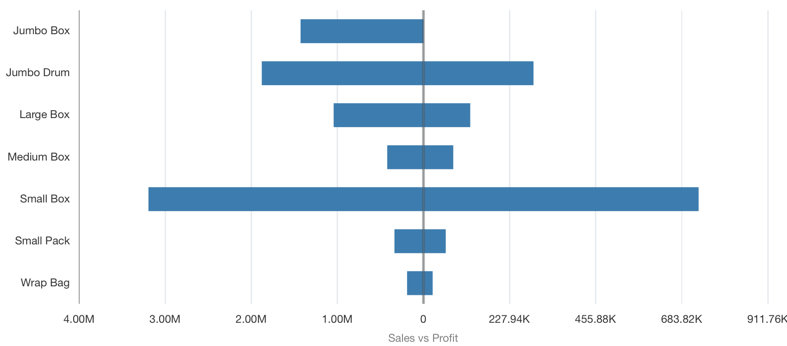
By Default the two metrics are on the same scale, but there is also an option "Synchronized Scales" that, when set to OFF will show the metric on different scales.
Datasources and Data Gateway
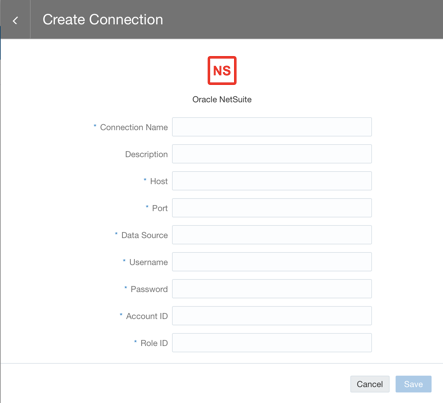
A new datasource definition to Oracle NetSuite is now available, allowing the connection by passing the parameters Datasource, Account ID and Role ID on top of the usual Host, Username and Password.
An enhancement has been published also for the Oracle Database connection: now you can select between a Basic connection and Advanced. The Basic option should be used when connecting to single node databases. The Advanced, on the other side, is useful when connecting to Cluster RAC DBs where multiple hostnames and ports need to be listed. When selecting the Advanced option we can simply add a custom connection string like the below
(DESCRIPTION
(ADDRESS_LIST= (LOAD_BALANCE=on)(FAILOVER=on)
(ADDRESS=(PROTOCOL=tcp)(HOST=hostname1.subnet.com)(PORT=1529))
(ADDRESS=(PROTOCOL=tcp)(HOST=hostname2.subnet.com)(PORT=1529))
(ADDRESS=(PROTOCOL=tcp)(HOST=hostname3.subnet.com)(PORT=1529))
...
(ADDRESS=(PROTOCOL=tcp)(HOST=hostnamen.subnet.com)(PORT=1529))
)
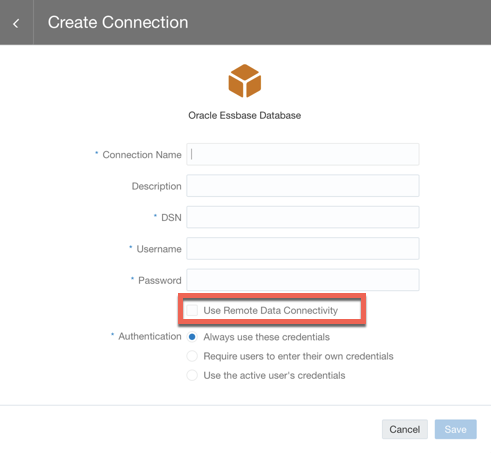
)A option is also available to use Data Gateway with Essbase sources, making the OAC on-premises Essbase connection only one click away by just enabling Use Data Gateway option in the screen. The usage of Data Gateway is also available now on BI Publisher allowing the pixel perfect reporting from on-premises datasources.
Another option in BI Publisher is Data Chunking, extremely useful for big reports since it allows the report execution in multiple sub-jobs in parallel with a final job to consolidate the results in a unique output.
The above are the news for this release, do you want more detailed examples on a particular features? Let me know in the comments and I'll write about it!
A decade in data, a decade to come
First of all I’d like to take the chance to wish everyone in our network, colleagues, customers and friends a very happy new year.
The last decade was an incredible one for the data industry. I realised before writing this that 2010 was actually when I started at my first data management consultancy, so it’s given me the perfect chance to reflect on what I’ve witnessed in the last 10 years.
Data Insights out of IT and into the business
One thing that stands out is the relevance of insights through data within business functions. The reason why we do what we do at Rittman Mead is because we believe that data solutions will drive positive change for us all in the future. Making it accessible, insightful and interesting to people who are doing great things for great companies is the goal for all of us.
During the last decade we saw the mass market adoption of line of business data discovery tools such as Tableau, Oracle Data Visualization, QlikSense & Microsoft PowerBI. All wonderfully innovative products that have flown the flag for bringing insights through data into the business.
What is Big Data?
Also, what has happened to the Big Data hype which was a huge back in 2010?
Ten years on do we think it lived up to its hype? Do we even know what it means? On reflection was it as groundbreaking as we might have thought at the time? This is an argument that could be had but might never end.
Public Cloud Cover
One thing is for sure - the adoption at scale of public Cloud, SaaS, Storage and what it seems is infinite amounts of processing power has been huge since 2010. We've seen AWS and Microsoft Azure leading the way, we see Google and Oracle Cloud Infrastructure catching up. We know there are pros, cons, knowns and unknowns when moving to Cloud hosted applications and platforms. We know that one thing is for sure - come 2030 the Cloud will be bigger whether we like it or not.
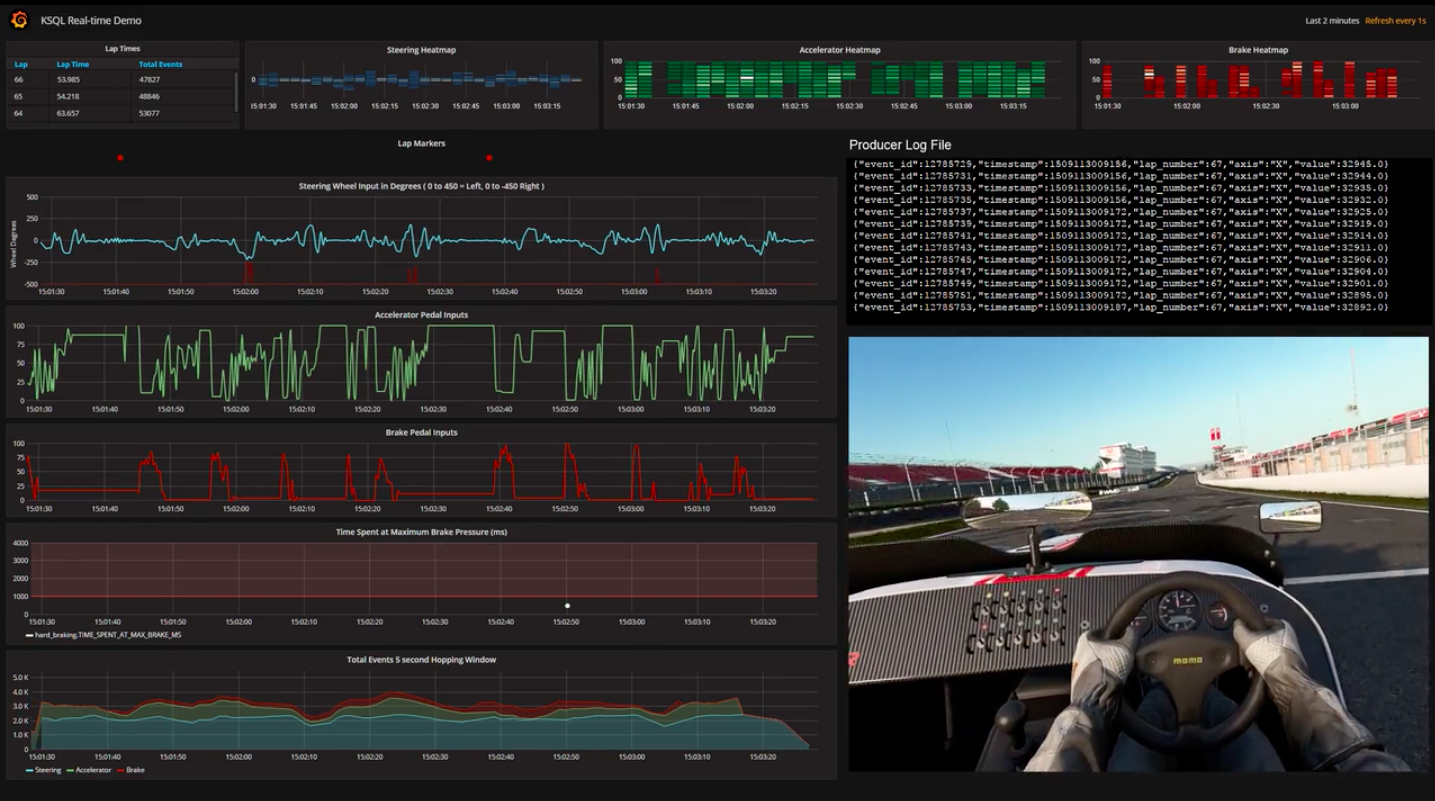
Streams of Events
Finally the emergence of event driven architectures is as innovative as it is complex. Large growth companies like Uber have built their business model on the ability to process huge amounts of events at low latency in order to operate. Think demand + supply and Uber’s dynamic pricing model. Fortunately open source projects like Kafka and particularly organisations like Confluent, the company behind Kafka, have made it easier to integrate this functionality to businesses throughout the world.
It wouldn’t be fair to say that the innovation in the data industry has always been used ethically in the last 10 years and this is something that we all have a part to play in going forwards. The Facebook / Cambridge Analytica scandal certainly made everyone reflect on the importance of using data for positive and ethical outcomes rather than underhand and in-transparent tactics.
And whats next?
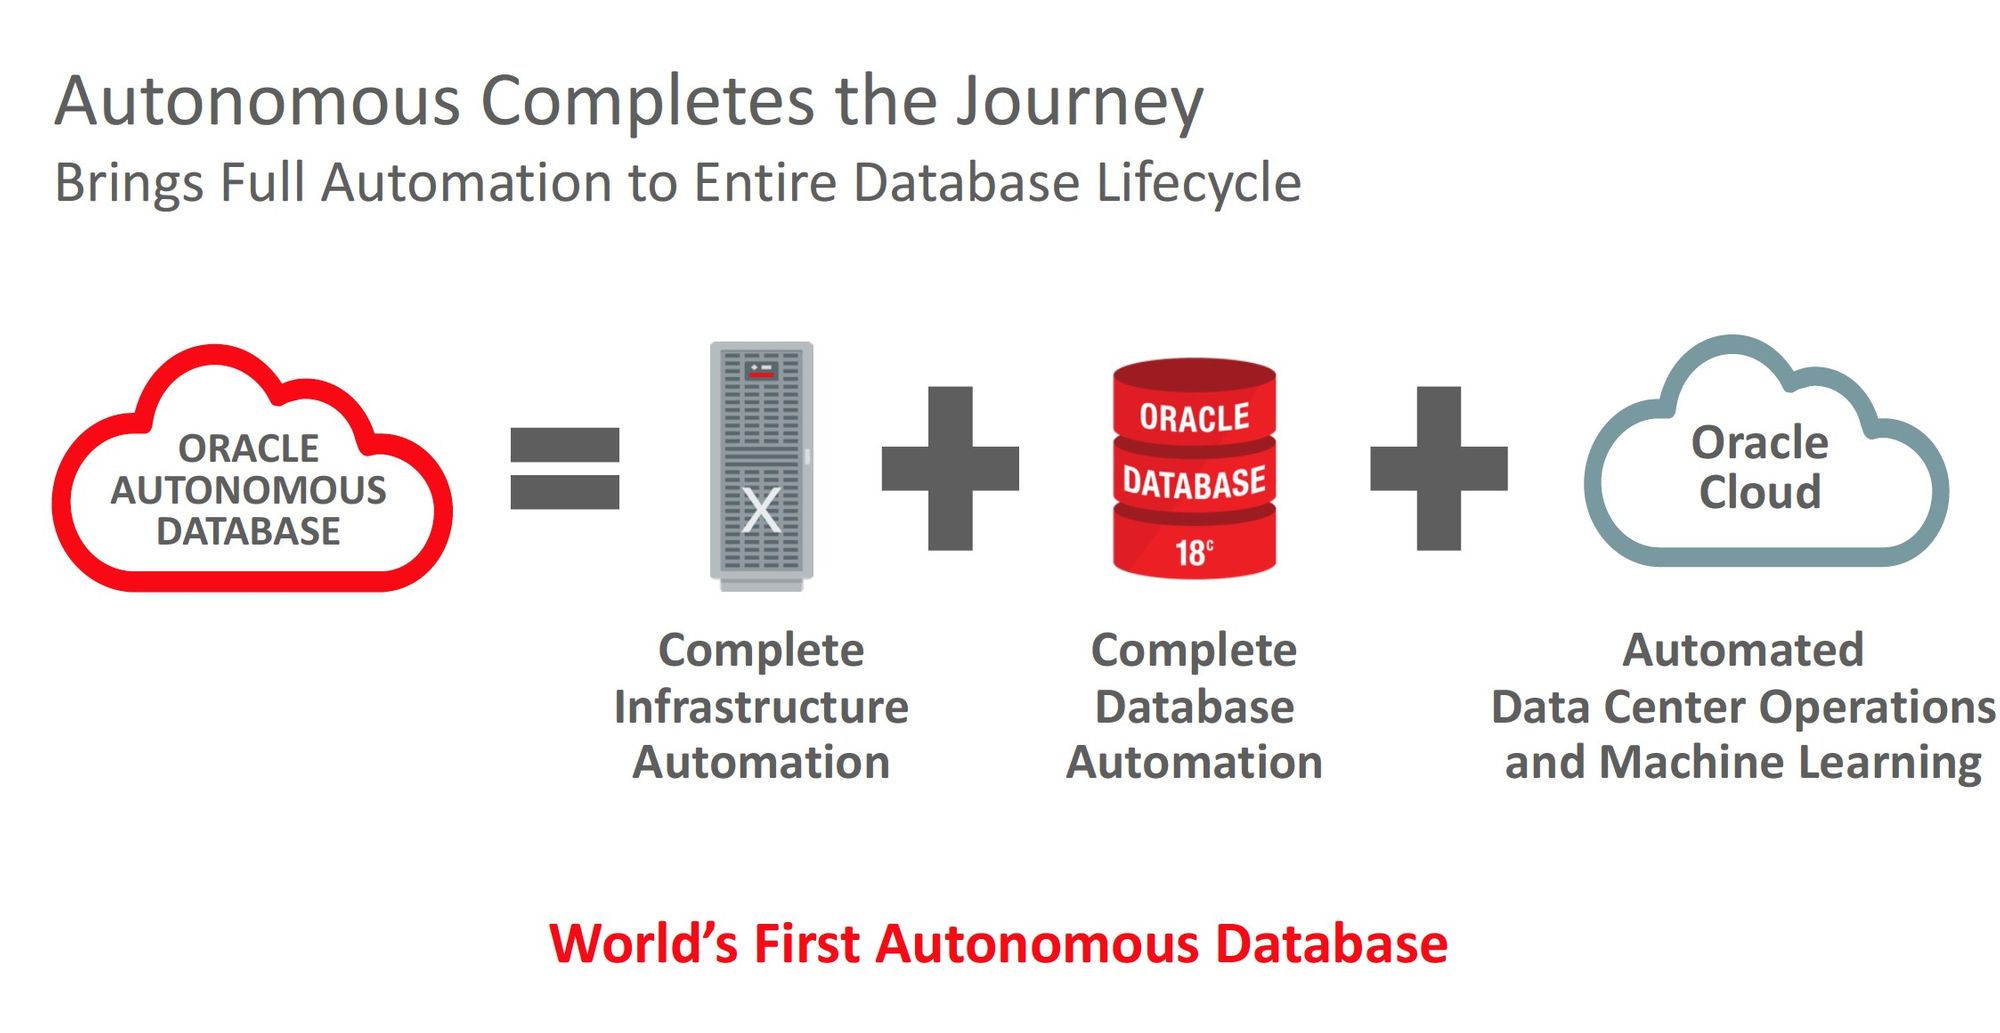
As we embark on a new decade, we at Rittman Mead are excited about what is to come. Artificial Intelligence, Machine Learning and Augmented Analytics is going to hit the mainstream and will play a part in all of our lives. But the good news is - there will always be a place in this market for people. Data is necessary, sophisticated machines are necessary but it relies on the people for it to work whether that be building an algorithm or making a decision based on the outcome of the information that a particular algorithm has generated. We will see more automation and this is a brilliant thing. Robotic Process Automation (RPA) and Autonomous databases such as Oracle’s offering are designed to breed innovation, not replacement.
Come and meet us in February
For us it all starts in February at Oracle OpenWorld Europe. We will be exhibiting and presenting here and there will be insightful, thought provoking and relatable content throughout the two days. Augmented analytics & autonomous will be at the top of the agenda and rightly so. What’s more, it’s completely free to attend. Registration details can be found here:

We’d love to meet with you if you do decide to come. To make this easier (as we know there is a lot to cover on days like these) we have set up a calendar where you can book a meeting slot with one of our sales team or technical consultants. We can talk about:
- Oracle
- AI/ML
- What are we doing?
- What are you doing?
- Anything you like in an informal setting
Please feel free to book a time slot using the link below:
https://calendly.com/rittman-mead/oracle-openworld
Finally we wish everyone a very prosperous new decade - who knows where will be by 2030!
Machine Learning and Spatial for FREE in the Oracle Database
Last week at UKOUG Techfest19 I spoke a lot about Machine Learning both with Oracle Analytics Cloud and more in depth in the Database with Oracle Machine Learning together with Charlie Berger, Oracle Senior Director of Product Management.
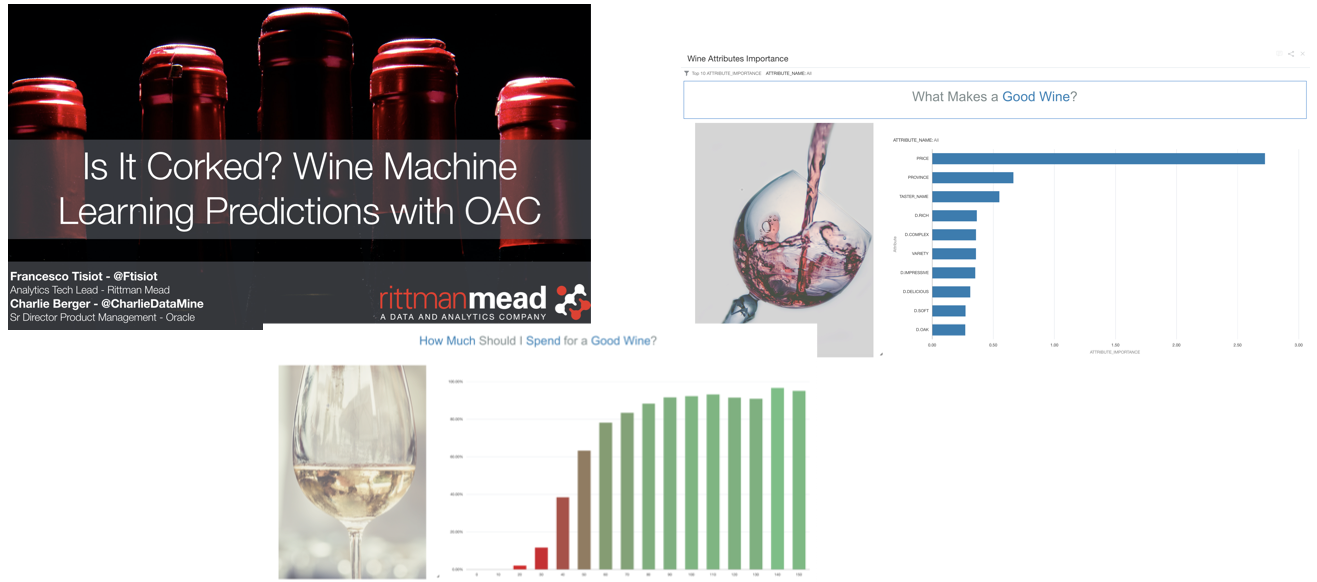
As mentioned several times in my previous blog posts, Oracle Analytics Cloud provides a set of tools helping Data Analysts start their path to Data Science. If, on the other hand, we're dealing with experienced Data Scientists and huge datasets, Oracle's proposal is to move Machine Learning where the data resides with Oracle Machine Learning. OML is an ecosystem of various options to perform ML with dedicated integration with Oracle Databases or Big Data appliances.
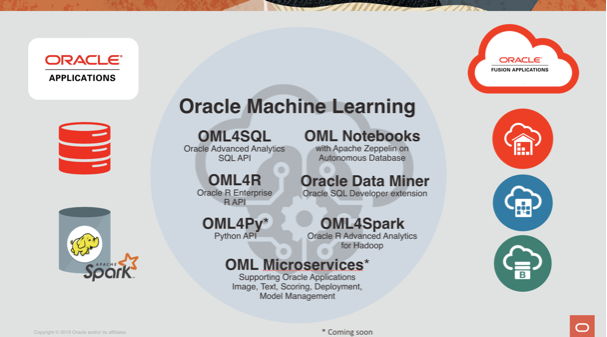
One of the most known branches is OML4SQL which provides the ability of doing proper data science directly in the database with PL/SQL calls! During the UKOUG TechFest19 talk Charlie Berger demoed it using a collaborative Notebook on top of an Autonomous Data Warehouse Cloud.
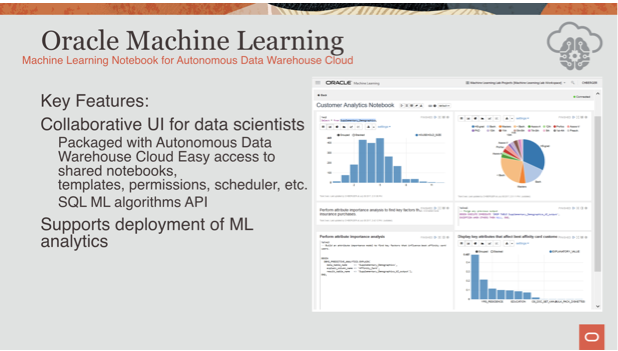
Both Oracle ADW and ATP include OML by default at no extra cost. This wasn't true for all the other database offerings in cloud or on-premises which required an additional option to be purchased (the Advanced Analytics one for on-premises deals). The separate license requirement was obviously something that limited the spread of this functionality, but, I'm happy to say that it's going away!
Oracle's blog post yesterday announced that:
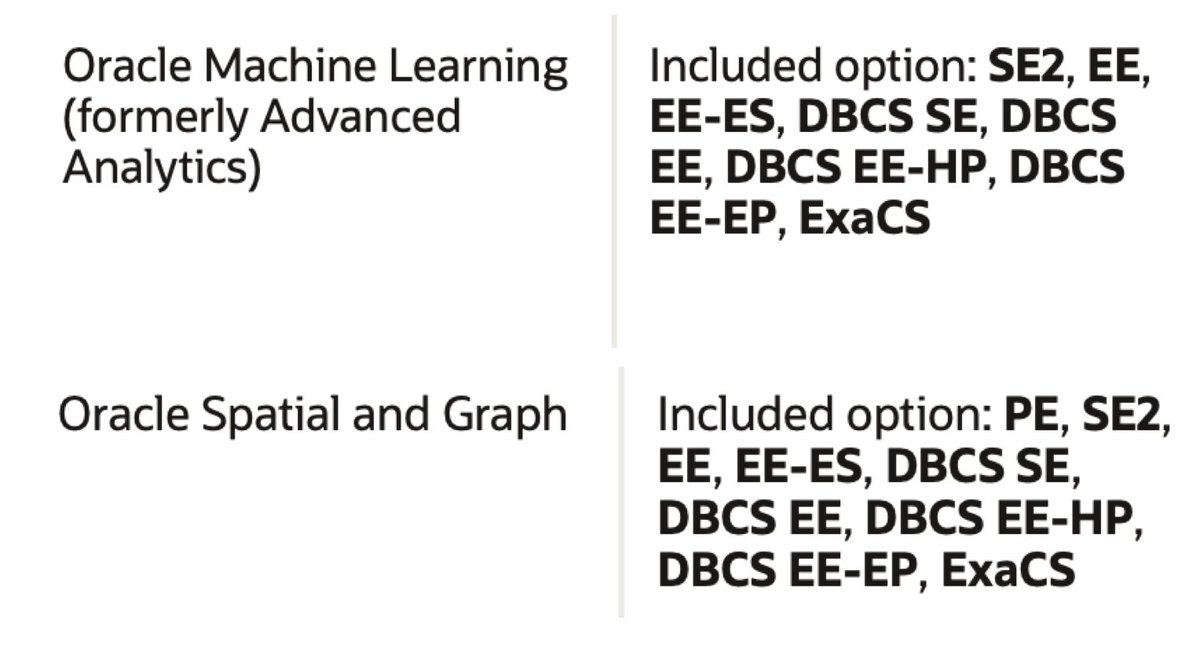
As of December 5, 2019, the Machine Learning (formerly known as Advanced Analytics), Spatial and Graph features of Oracle Database may be used for development and deployment purposes with all on-prem editions and Oracle Cloud Database Services. See the Oracle Database Licensing Information Manual (pdf) for more details.
What this means is that both features are included for FREE within the Oracle Database License! Great news for both Machine Learning as well as Graph Databases fans! The following tweet from Dominic Giles (Master Product Manager for the Oracle DB) provides a nice summary of the licenses including the two options for the Oracle DB 19c.
The #Oracle Database now has some previously charged options added to the core functionality of both Enterprise Edition and Standard Edition 2. Details in the 19c licensing guide with more information to follow. pic.twitter.com/dqkRRQvWq2
— dominic_giles (@dominic_giles) December 5, 2019
But hey, this license change effects also older versions starting from the 12.2, the older one still in general support! So, no more excuses, perform Machine Learning where your data is: in the database with Oracle Machine Learning!
Timestamp Functions and Presentation Variables in Oracle Cloud Analytics
One of the most popular Rittman Mead blog posts over the last 10 years is Timestamps and Presentation Variables. As we are seeing more and more migrations to OAC, we decided to review and revise this post for the latest version of Oracle Cloud Analytics (OAC), 105.4.0-140 as of October 2019. Read more about the latest updates here.
--
One could say that creating a chart is not the most complex task in the world of Business Intelligence but we would argue that creating a meaningful report that perfectly illustrates the message hidden in data and therefore adds value to the management is nowhere close to being easy! A good way to make a report as informative as possible is to use trends and comparison. And to do so, a perfect tool would be the time analysis functions. For example comparing sales in a period of time this year to the same period of time the year before. Or measure the similarity or dissimilarity of sales in different months of the year.
Demo Platform
I have used a free trial instance of OAC for this demo. If you haven’t done yet, sign up for a free 30-day trial Oracle Cloud account (different to an Oracle account). Use the account to access the Oracle Cloud Infrastructure (OCI) console which is the latest Oracle movement towards having one integrated cloud platform to manage all your Oracle cloud applications, platforms, and infrastructure in one place.
From the OCI console it is 5 to 10 minutes before your free trial instance of OAC is up and running. For the detailed step by step of creating a new instance read here.
Demo Goals
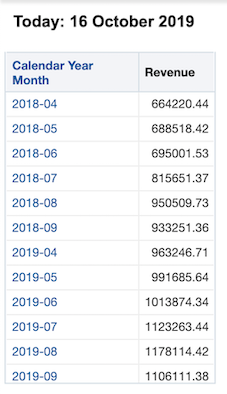
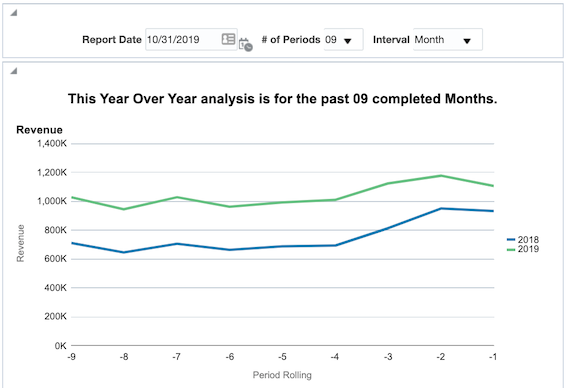
In this blog post I intend to show you how to combine the power of timestamp functions and presentation variables to create robust, repeatable reports. We will create a report that displays a year over year analysis for any rolling number of periods, by week or month, from any date in time, all determined by the user. This entire demo will only use values from a date and a revenue field.
TIMESTAMP Functions
TIMESTAMPADD() manipulates data of the data types DATE and DATETIME based on a calendar year.
Syntax: TIMESTAMPADD(interval, expr, timestamp)
Example: TIMESTAMPADD(SQL_TSI_MONTH, 12,Time."Order Date")
Description: Adds a specified number of intervals to a timestamp, and returns a single timestamp.
Timestamp Interval (TSI) Options: SQL_TSI_SECOND, SQL_TSI_MINUTE, SQL_TSI_HOUR, SQL_TSI_DAY, SQL_TSI_WEEK, SQL_TSI_MONTH, SQL_TSI_QUARTER, SQL_TSI_YEAR
Read more about other calendar functions.
Building Filters
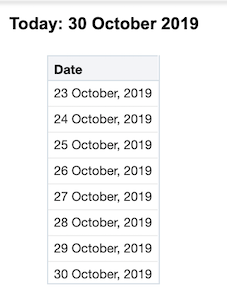
Starting to build our demo, the filter below returns all dates greater than or equal to 7 days ago including the current date.

In other words we have now a functional filter to select all the rows where Date >= a week ago.
As a good practice, always include a second filter giving an upper limit to the time filter. For example "Periods"."Day Date" < CURRENT_DATE would confirm that there won’t be any records that you don’t want in the mix and therefore no unnecessary strain on the system.
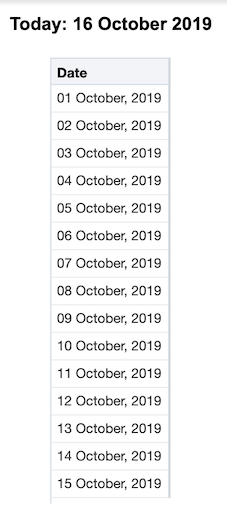
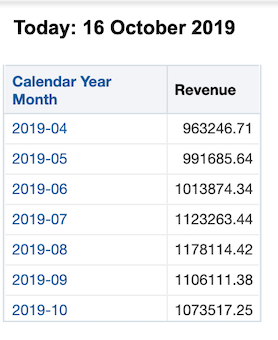
Let’s go one step further, instead of going 7 days back, we could try and include all the previous days in the current month or in other words dates >= the first day of the month. In this scenario, we can use the DAYOFMONTH() function to get the calendar day of any date. From here it will be easy to calculate the number of days in the month so far. Our new filter would look like this:
For example, if today is October 16th, DAYOFMONTH(CURRENT_DATE) would equal 16. Thus, we would subtract 16 days from CURRENT_DATE to go back to September 30th, and adding one will give us October 1st.
Presentation Variables
A presentation variable is a variable that can be created from the front end, the Analytics as part of one of the following types of dashboard prompts:
- Column prompt, Associated with a column and the values that it can take come from the column values. For information on working with column prompts, see Creating a Column Prompt.
- Variable prompt, Not associated with any column, and you define the values that it can take. For information on working with variable prompts, see Creating a Variable Prompt.
Each time a user selects a value in the column or variable prompt, the value of the presentation variable is set to the value that the user selects and will then be sent to any references of that filter throughout the dashboard page. This could be filters, formulas and even text boxes.
The first presentation variable we could introduce is to replace the CURRENT_DATE with a prompted value. Let’s call this presentation variable pv_Date,
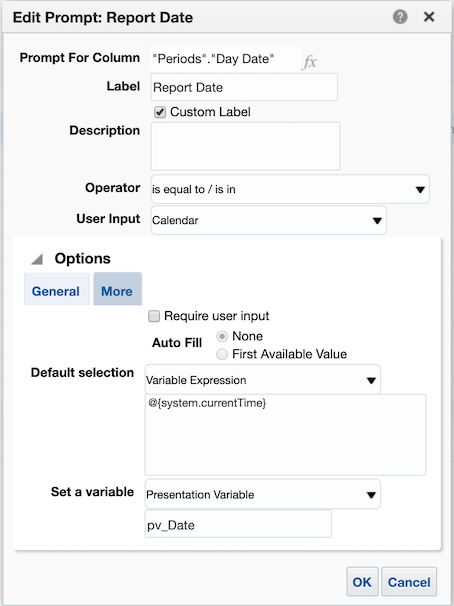
- Use the syntax
@{pv_Date}to call this variable in the reports. - For variables of type string, surround the name in single quotes:
‘@{pv_String]’ - It is good practice to assign a default value to the presentation variables so that you can work with your report before publishing it to a dashboard. For example the default value for the
pv_DateisCURRENT_DATEso the new syntax would be@{pv_Date}{CURRENT_DATE}
Demo Time!
Our updated filter after replacing the CURRENT_DATE looks like below. Will will refer to this filter later as Filter 1 (F1).

The filter is starting to take shape. Now let's say we are going to always be looking at a date range of six months before the selected date. All we would need to do is create a nested TIMESTAMP function. To do this, we will “wrap” our current TIMESTAMP with another that will subtract six months:

Now we have a filter to select dates that are greater than or equal to the first day of the month of any given date and all the six months prior to that.
To take this one step further, we can create another presentation variable called pv_n to allow the users to determine the amount of months to include in this analysis from a dashboard prompt.
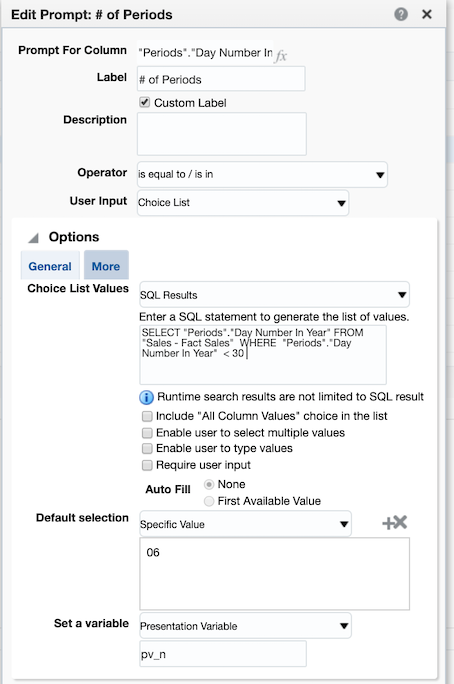
Here is the updated version of our filter using the number of periods presentation variable and a default value of 6, @{pv_n}{6}. We will refer to the following filter as Filter 2 (F2).

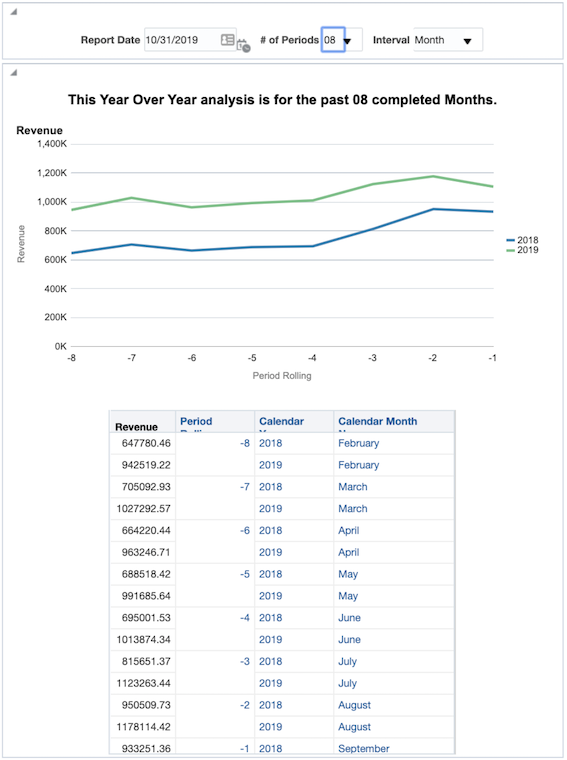
Our TIMESTAMPADD function is now fairly robust and will give us any date greater than or equal to the first day of the month from n months ago from any given date. Now we will see what we just created in action by creating date ranges to allow for a Year over Year analysis for any number of months. Consider the following filter set:
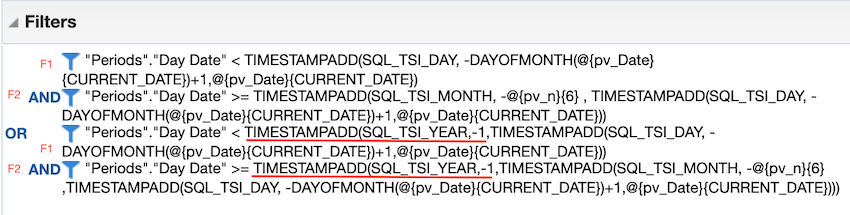
This may appear to be pretty intimidating at first but if we break it into parts we can start to understand its purpose. Notice we are using the exact same filters from before; Filter 1 and Filter 2. What we have done here is filtered on two time periods, separated by the OR statement.
- The first date range defines the period as being the most recent completed n months from any given prompted date value, using a presentation variable with a default of today. Dates in the current month have been removed from the set by Filter 1.
- The second time period, after the OR statement, is the exact same as the first only it has been wrapped in another TIMESTAMP function subtracting a year, giving you the exact same time frame for the year prior.
This allows us to create a report that can run a year over year analysis for a rolling n month time frame determined by the user.
A note on nested TIMESTAMPS: you will always want to create nested TIMESTAMPS with the smallest interval first. Then you will wrap intervals as necessary. In this case our smallest increment is day, wrapped by month, wrapped by year.
Let’s Go Crazy
A more advanced trick, If you use real time or near real time reporting: using CURRENT_DATE may be how you want to proceed. Otherwise, instead of using today as your default date value, use yesterday’s date since most data are only as current as yesterday. Using yesterday will be valuable especially when pulling reports on the first day of the month or year - you generally want the entire previous time period rather than the empty beginning of a new one. So, to implement, wherever you have @{pDate}{CURRENT_DATE} replace it with @{pDate}{TIMESTAMPADD(SQL_TSI_DAY,-1,CURRENT_DATE)}
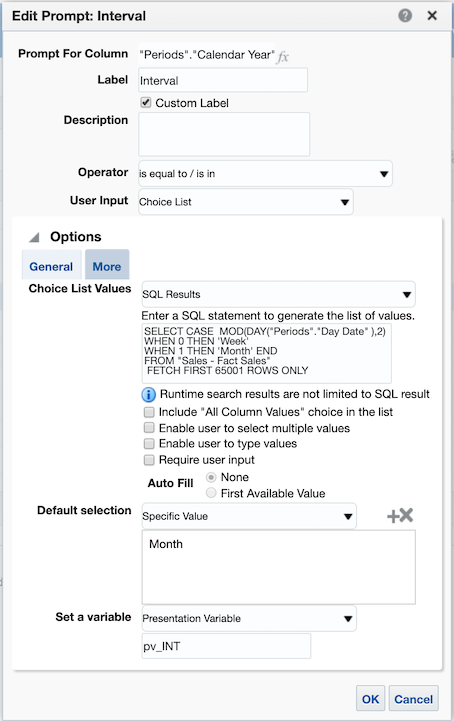
One more change on our filter to make it extra-flexible here is to use a new presentation variable to determine if you want to display year over year values, or by month, or by week. This can be done by inserting a variable into your SQL_TSI_MONTH and DAYOFMONTH statements; changing MONTH to SQL_TSI_@{pv_INT}{MONTH} and DAYOF@{pv_INT}{MONTH}, where pv_INT is the name of our variable.
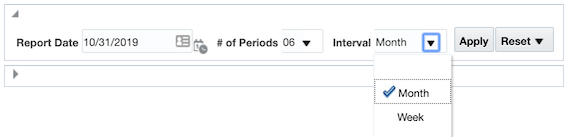
Start by creating a dummy variable in your prompt to allow users to select either MONTH or WEEK. You can try something like this: CASE MOD(DAY("Time"."Date"),2) WHEN 0 'WEEK' WHEN 1 THEN 'MONTH' END
The updated filter now look like this:
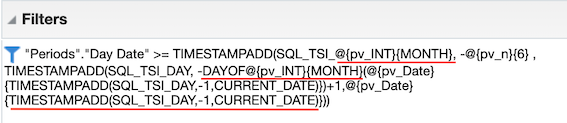
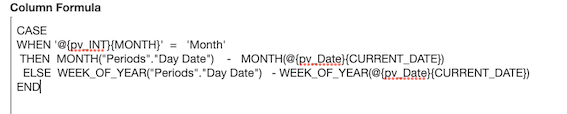
In order for our interaction between Month and Week to run smoothly we have to factor in one last consideration: if we are to take the date December 1st, 2019 and subtract one year we get December 1st, 2018. However, if we take the first day of this week, Sunday December 15, 2019 and subtract one year we get Saturday December 15, 2014. In our analysis this will cause an extra partial week to show up for prior years. To get around this we will add a case statement determining if '@{pv_INT}{MONTH}' = 'Week' THEN subtract 52 weeks from the first of the week ELSE subtract 1 year from the first of the month. With this, our final filter set will look like this:
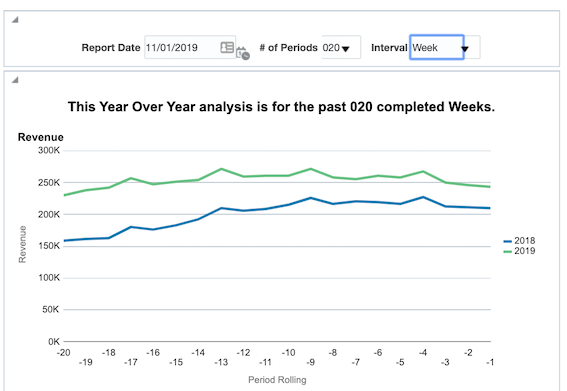
With the use of these filters and some creative dashboarding, you can construct a report that easily allows you to view a year over year analysis from any date in time for any number of periods either by month or by week.
Filtered by Week intervals;
The formula below will give you the value of period rolling to use in the analysis;
In this post, we created a cloud version of the amazing demo previously described by Brian Hall. As demonstrated, Timestamp functions and their power have been within the interesting topics of the visualisation and reporting for as long as we at Rittman Mead remember and can still be used in the realm of the Oracle Cloud Services in a very similar way as the past.
Feel free to get in touch, let us know your reviews and comments.

