Tag Archives: Oracle GoldenGate
Streaming data from Oracle using Oracle GoldenGate and Kafka Connect
This article was also posted on the Confluent blog, head over there for more great Kafka-related content!
Kafka Connect is part of the Confluent Platform, providing a set of connectors and a standard interface with which to ingest data to Kafka, and store or process it the other end. Initially launched with a JDBC source and HDFS sink, the list of connectors has grown to include a dozen certified connectors, and twice as many again 'community' connectors. These cover technologies such as MongoDB, InfluxDB, Kudu, MySQL - and of course as with any streaming technology, twitter, the de-facto source for any streaming how-to. Two connectors of note that were recently released are for Oracle GoldenGate as a source, and Elasticsearch as a sink. In this article I'm going to walk through how to set these up, and demonstrate how the flexibility and power of the Kafka Connect platform can enable rapid changes and evolutions to the data pipeline.
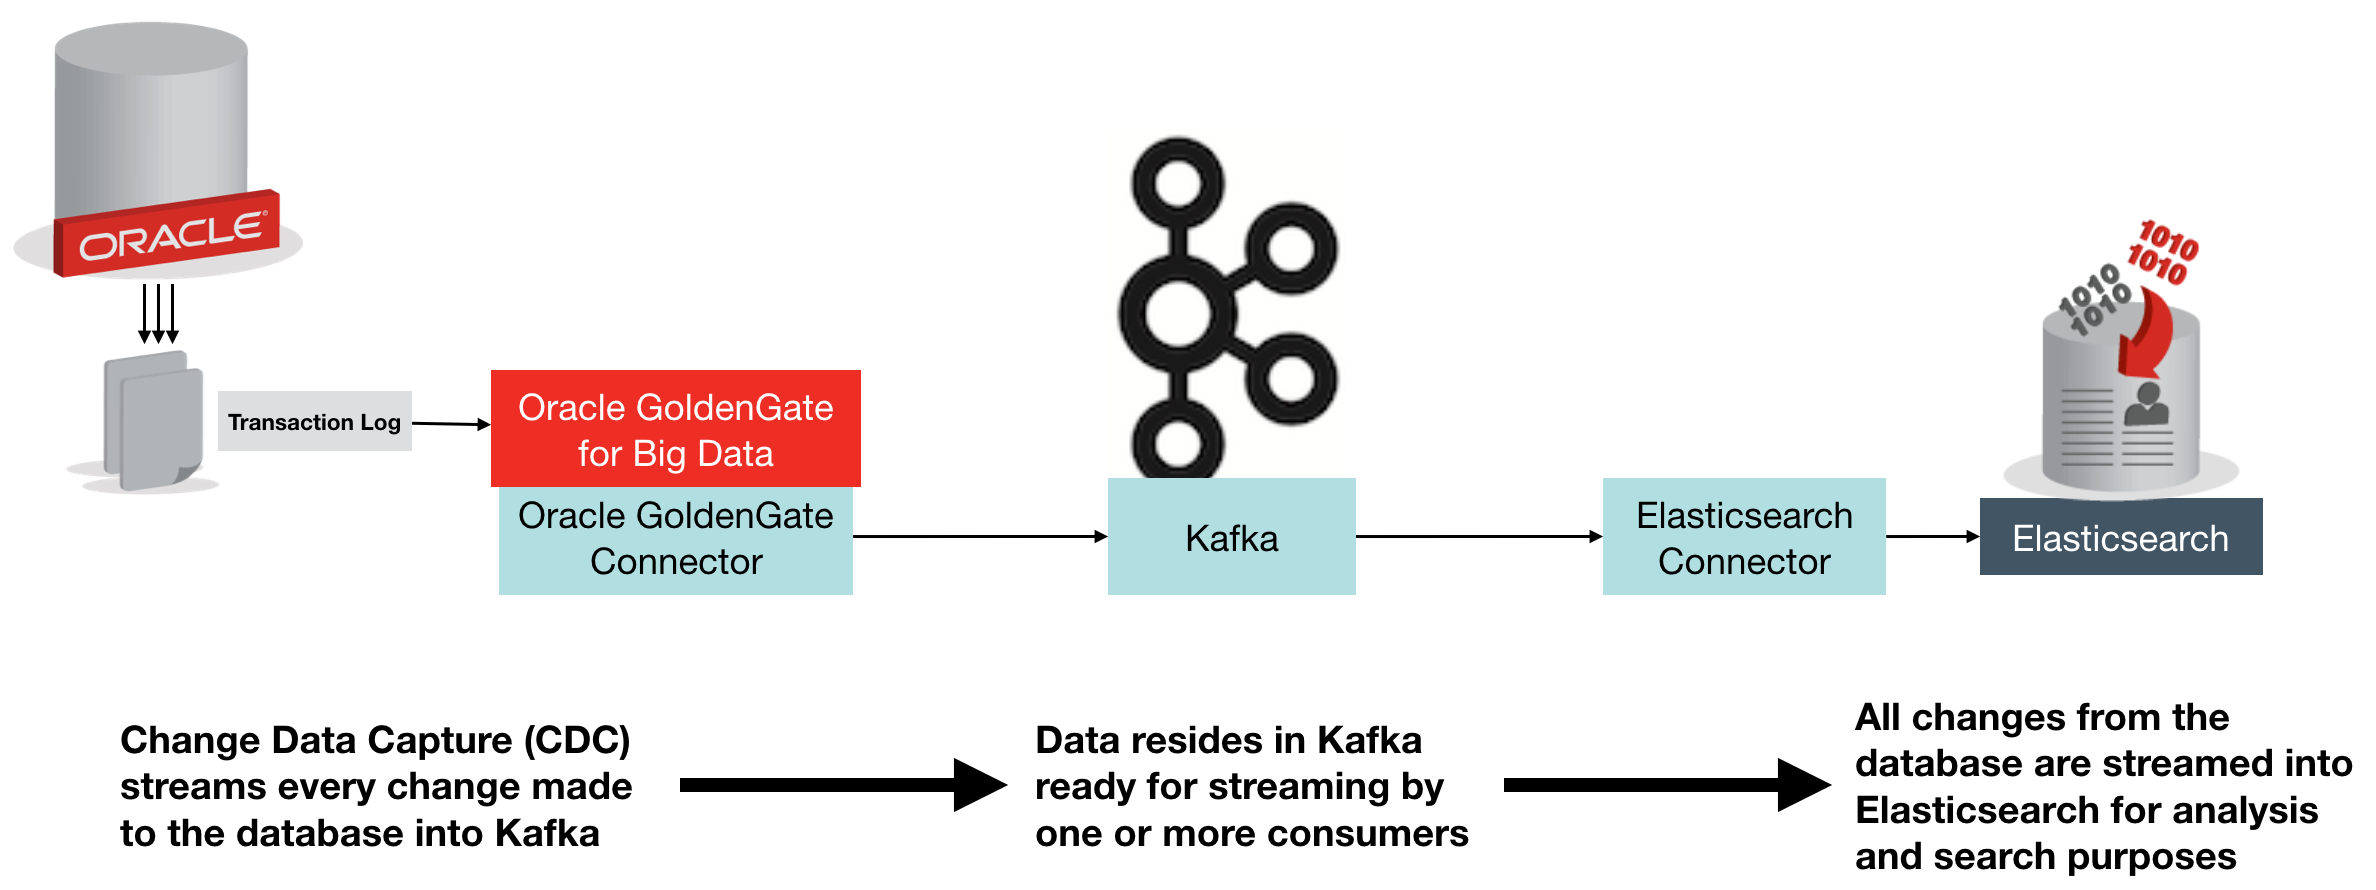
The above diagram shows an overview of what we're building. Change Data Capture (CDC) on the database streams every single change made to the data over to Kafka, from where it is streamed into Elasticsearch. Once in Elasticsearch it can be viewed in tools search as Kibana, for search and analytics:

Oracle GoldenGate (OGG) is a realtime data replication tool, falling under the broad umbrella of Change Data Capture (CDC) software, albeit at the high end in terms of functionality. It supports multiple RDBMS platforms, including - obviously - Oracle, as well as DB2, MySQL, and SQL Server. You can find the full certification list here. It uses log-based technology to stream all changes to a database from source, to target - which may be another database of the same type, or a different one. It is commonly used for data integration, as well as replication of data for availability purposes.
In the context of Kafka, Oracle GoldenGate provides a way of streaming all changes made to a table, or set of tables, and making them available to other processes in our data pipeline. These processes could include microservices relying on an up-to-date feed of data from a particular table, as well as persisting a replica copy of the data from the source system into a common datastore for analysis alongside data from other systems.
Elasticsearch is an open-source distributed document store, used heavily for both search, and analytics. It comes with some great tools including Kibana for data discovery and analysis, as well as a Graph tool. Whilst Elasticsearch is capable of being a primary data store in its own right, it is also commonly used as a secondary store in order to take advantage of its rapid search and analytics capabilities. It is the latter use-case that we're interested in here - using Elasticsearch to store a copy of data produced in Oracle.
Confluent's Elasticsearch Connector is an open source connector plug-in for Kafka Connect that sends data from Kafka to Elasticsearch. It is highly efficient, utilising Elasticsearch's bulk API. It also supports all Elasticsearch's data types which it automatically infers, and evolves the Elasticsearch mappings from the schema stored in Kafka records.
Oracle GoldenGate can be used with Kafka to directly stream every single change made to your database. Everything that happens in the database gets recorded in the transaction log (OGG or not), and OGG takes that ands sends it to Kafka. In this blog we're using Oracle as the source database, but don't forget that Oracle GoldenGate supports many sources. To use Oracle GoldenGate with Kafka, we use the "Oracle GoldenGate for Big Data" version (which has different binaries). Oracle GoldenGate has a significant advantage over the JDBC Source Connector for Kafka Connect in that it is a 'push' rather than periodic 'pull' from the source, thus it :
- Has much lower latency
- Requires less resource on the source database, since OGG mines the transaction log instead of directly querying the database for changes made based on a timestamp or key.
- Scales better, since entire schemas or whole databases can be replicated with minimal configuration changes. The JDBC connector requires each table, or SQL statement, to be specified.
Note that Oracle Golden Gate for Big Data also has its own native Kafka Handler, which can produce data in various formats directly to Kafka (rather than integrating with the Kafka Connect framework).
Environment
I'm using the Oracle BigDataLite VM 4.5 as the base machine for this. It includes Oracle 12c, Oracle GoldenGate for Big Data, as well as a CDH installation which provides HDFS and Hive for us to also integrate with later on.
On to the VM you need to also install:
- Confluent Plaform 3.0
- Oracle GoldenGate Kafka Connect connector
- Elasticsearch Kafka Connect connector
- Elasticsearch 2.4
To generate the schema and continuous workload, I used Swingbench 2.5.
For a step-by-step guide on how to set up these additional components, see this gist.
Starting Confluent Platform
There are three processes that need starting up, and each retains control of the session, so you'll want to use screen/tmux here, or wrap the commands in nohup [.. command ..] & so that they don't die when you close the window.
On BigDataLite the Zookeeper service is already installed, and should have started at server boot:
[oracle@bigdatalite ~]$ sudo service zookeeper-server status
zookeeper-server is running
If it isn't running, then start it with sudo service zookeeper-server start.
Next start up Kafka:
# On BigDataLite I had to remove this folder for Kafka to start
sudo rm -r /var/lib/kafka/.oracle_jre_usage
sudo /usr/bin/kafka-server-start /etc/kafka/server.properties
and finally the Schema Registry:
sudo /usr/bin/schema-registry-start /etc/schema-registry/schema-registry.properties
Note that on BigDataLite the Oracle TNS Listener is using port 8081 - the default for the Schema Registry - so I amended /etc/schema-registry/schema-registry.properties to change
listeners=http://0.0.0.0:8081
to
listeners=http://0.0.0.0:18081
Configuring Oracle GoldenGate to send transactions to Kafka Connect
Oracle GoldenGate (OGG) works on the concept of an Extract process which reads the source-specific transaction log and writes an OGG trail file in a generic OGG format. From this a Replicat process reads the trail file and delivers the transactions to the target.
In this example we'll be running the Extract against Oracle database, specifically, the SOE schema that Swingbench generated for us - and which we'll be able to generate live transactions against using Swingbench later on.
The Replicat will be sending the transactions from the trail file over to Kafka Connect.
I'm assuming here that you've already successfully defined and set running an extract against the Swingbench schema (SOE), with a trail file being delivered to /u01/ogg-bd/dirdat. For a step-by-step guide on how to do this all from scratch, see here.
You can find information about the OGG-Kafka Connect adapter in the README here.
To use it, first configure the replicat and supporting files as shown.
Replicat parameters
Create
/u01/ogg-bd/dirprm/rconf.prmwith the following contents:REPLICAT rconf TARGETDB LIBFILE libggjava.so SET property=dirprm/conf.props REPORTCOUNT EVERY 1 MINUTES, RATE GROUPTRANSOPS 1000 MAP *.*.*, TARGET *.*.*;Handler configuration
Edit the existing
/u01/ogg-bd/dirprm/conf.propsand amendgg.classpathas shown below. The classpath shown works for BigDataLite - on your own environment you need to make the necessary jar files available per the dependencies listed in the README.gg.handlerlist=confluent #The handler properties gg.handler.confluent.type=oracle.goldengate.kafkaconnect.KafkaConnectHandler gg.handler.confluent.kafkaProducerConfigFile=confluent.properties gg.handler.confluent.mode=tx gg.handler.confluent.sourceRecordGeneratorClass=oracle.goldengate.kafkaconnect.DefaultSourceRecordGenerator #The formatter properties gg.handler.confluent.format=oracle.goldengate.kafkaconnect.formatter.KafkaConnectFormatter gg.handler.confluent.format.insertOpKey=I gg.handler.confluent.format.updateOpKey=U gg.handler.confluent.format.deleteOpKey=D gg.handler.confluent.format.treatAllColumnsAsStrings=false gg.handler.confluent.format.iso8601Format=false gg.handler.confluent.format.pkUpdateHandling=abend goldengate.userexit.timestamp=utc goldengate.userexit.writers=javawriter javawriter.stats.display=TRUE javawriter.stats.full=TRUE gg.log=log4j gg.log.level=INFO gg.report.time=30sec #Set the classpath here gg.classpath=dirprm/:/u01/ogg-bd/ggjava/resources/lib*:/usr/share/java/kafka-connect-hdfs/*:/usr/share/java/kafka/* javawriter.bootoptions=-Xmx512m -Xms32m -Djava.class.path=.:ggjava/ggjava.jar:./dirprmNote the
gg.log.levelsetting - this can be very useful to switch toDEBUGif you're investigating problems with the handler.Kafka Connect settings
Edit the existing
/u01/ogg-bd/dirprm/confluent.propertiesand amend theschema.registry.urlURL to reflect the port change made above. All other values can be left as defaults.bootstrap.servers=localhost:9092 value.serializer=org.apache.kafka.common.serialization.ByteArraySerializer key.serializer=org.apache.kafka.common.serialization.ByteArraySerializer schema.registry.url=http://localhost:18081 value.converter=org.apache.kafka.connect.json.JsonConverter key.converter=org.apache.kafka.connect.json.JsonConverter internal.value.converter=org.apache.kafka.connect.json.JsonConverter internal.key.converter=org.apache.kafka.connect.json.JsonConverter
Now we can add the replicat. If not already, launch ggsci from the ogg-bd folder:
cd /u01/ogg-bd/
rlwrap ./ggsci
and define the replicat, and start it
ADD REPLICAT RCONF, EXTTRAIL ./dirdat/rt
START RCONF
Check its status:
GGSCI (bigdatalite.localdomain) 13> INFO RCONF
REPLICAT RCONF Last Started 2016-09-02 15:39 Status RUNNING
Checkpoint Lag 00:00:00 (updated 00:00:02 ago)
Process ID 25415
Log Read Checkpoint File ./dirdat/rt000000000
First Record RBA 0
Note that on BigDataLite 4.5 VM there are two existing replicats configured, RKAFKA and RMOV. You can ignore these, or delete them if you want to keep things simple and clear.
Testing the Replication
We'll run Swingbench in a moment to generate some proper throughput, but let's start with a single transaction to check things out.
Connect to Oracle and insert a row, not forgetting to commit the transaction (he says, from frustrating experience ;) )
[oracle@bigdatalite ogg]$ sqlplus soe/soe@orcl
SQL*Plus: Release 12.1.0.2.0 Production on Fri Sep 2 15:48:18 2016
Copyright (c) 1982, 2014, Oracle. All rights reserved.
Last Successful login time: Fri Sep 02 2016 12:48:22 +01:00
Connected to:
Oracle Database 12c Enterprise Edition Release 12.1.0.2.0 - 64bit Production
With the Partitioning, OLAP, Advanced Analytics and Real Application Testing options
SQL> insert into soe.logon values (42,42,sysdate);
1 row created.
SQL> commit;
Commit complete.
SQL> select * from soe.logon where logon_id=42;
LOGON_ID CUSTOMER_ID LOGON_DAT
---------- ----------- ---------
42 50865 12-AUG-11
42 42 02-SEP-16
Now if you list the topics defined within Kafka, you should see a new one has been created, for the SOE.LOGON table:
[oracle@bigdatalite dirrpt]$ kafka-topics --zookeeper localhost:2181 --list
SLF4J: Class path contains multiple SLF4J bindings.
SLF4J: Found binding in [jar:file:/usr/lib/zookeeper/lib/slf4j-log4j12-1.7.5.jar!/org/slf4j/impl/StaticLoggerBinder.class]
SLF4J: Found binding in [jar:file:/usr/share/java/kafka/slf4j-log4j12-1.7.21.jar!/org/slf4j/impl/StaticLoggerBinder.class]
SLF4J: See http://www.slf4j.org/codes.html#multiple_bindings for an explanation.
SLF4J: Actual binding is of type [org.slf4j.impl.Log4jLoggerFactory]
ORCL.SOE.LOGON
_schemas
and you can view the record:
[oracle@bigdatalite dirrpt]$ kafka-console-consumer --zookeeper localhost:2181 --topic ORCL.SOE.LOGON --from-beginning
{"schema":{"type":"struct","fields":[{"type":"string","optional":false,"field":"table"},{"type":"string","optional":false,"field":"op_type"},{"type":"string","optional":false,"field":"op_ts"},{"type":"string","optional":false,"field":"current_ts"},{"type":"string","optional":false,"field":"pos"},{"type":"double","optional":true,"field":"LOGON_ID"},{"type":"double","optional":true,"field":"CUSTOMER_ID"},{"type":"string","optional":true,"field":"LOGON_DATE"}],"optional":false,"name":"ORCL.SOE.LOGON"},"payload":{"table":"ORCL.SOE.LOGON","op_type":"I","op_ts":"2016-09-02 14:56:26.000411","current_ts":"2016-09-02 15:56:34.111000","pos":"00000000000000002010","LOGON_ID":42.0,"CUSTOMER_ID":42.0,"LOGON_DATE":"2016-09-02:15:56:25"}}
Hit Ctrl-C to cancel the consumer -- otherwise it'll sit there and wait for additional messages to be sent to the topic. Useful for monitoring when we've got lots of records flowing through, but not so useful now.
The message is JSON, so a useful tool to install is jq:
sudo yum install -y jq
You can then pipe the output of kafka-console-consumer through jq to pretty-print it:
[oracle@bigdatalite dirrpt]$ kafka-console-consumer --zookeeper localhost:2181 --topic ORCL.SOE.LOGON --from-beginning|jq '.'
{
"payload": {
"LOGON_DATE": "2016-09-02:15:56:25",
"CUSTOMER_ID": 42,
"LOGON_ID": 42,
"pos": "00000000000000002010",
"current_ts": "2016-09-02 15:56:34.111000",
"op_ts": "2016-09-02 14:56:26.000411",
"op_type": "I",
"table": "ORCL.SOE.LOGON"
},
[...]
or even show just sections of the message using jq's syntax (explore it here):
[oracle@bigdatalite dirrpt]$ kafka-console-consumer --zookeeper localhost:2181 --topic ORCL.SOE.LOGON --from-beginning|jq '.payload.op_ts'
"2016-09-02 14:56:26.000411"
So we've got successful replication of Oracle transactions into Kafka, via Oracle GoldenGate. Now let's bring Elasticsearch into the mix.
Configuring Elasticsearch
We're going to use Elasticsearch as a destination for storing the data coming through Kafka from Oracle. Each Oracle table will map to a separate Elasticsearch index. In Elasticsearch an 'index' is roughly akin to an RDBMS table, a 'document' to a row, a 'field' to a column, and a 'mapping' to a schema.
Elasticsearch itself needs no configuration out of the box if you want to just get up and running with it, you simply execute it:
/opt/elasticsearch-2.4.0/bin/elasticsearch
Note that this wouldn't suffice for a Production deployment, in which you'd want to allocate heap space, check open file limits, configure data paths, and so on.
With Elasticsearch running, you can then load Kopf, which is a web-based admin plugin. You'll find it at http://<server>:9200/_plugin/kopf
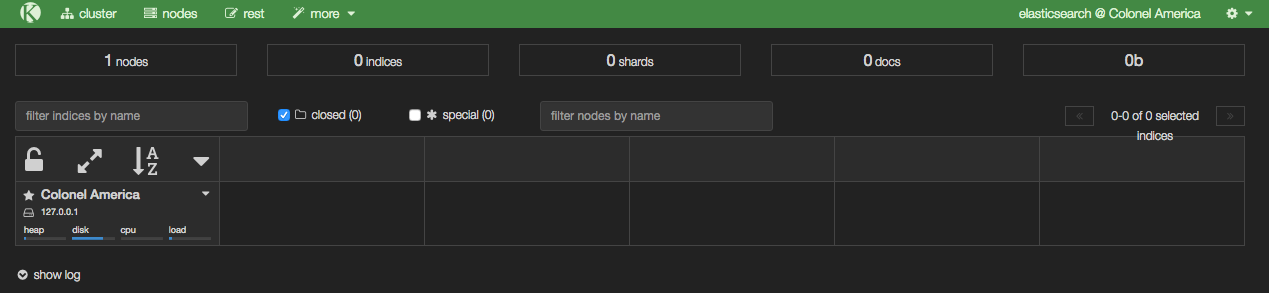
From Kopf you can see which nodes there are in the Elasticsearch cluster (just the one at the moment, with a random name inspired by Marvel), along with details of the indices as they're created - in the above screenshot there are none yet, because we've not loaded any data.
Setting up the Elasticsearch Kafka Connect handler
Create a configuration file for the Elasticsearch Kafka Connect handler. I've put it in with the Elasticsearch configuration itself at /opt/elasticsearch-2.4.0/config/elasticsearch-kafka-connect.properties; you can use other paths if you want.
The defaults mostly suffice to start with, but we do need to update the topics value:
name=elasticsearch-sink
connector.class=io.confluent.connect.elasticsearch.ElasticsearchSinkConnector
tasks.max=1
connection.url=http://localhost:9200
type.name=kafka-connect
# Custom config
topics=ORCL.SOE.LOGON
Because Elasticsearch indices cannot be uppercase, we need to provide a mapping from the Kafka topic to the Elasticsearch index, so add a configuration to the file:
topic.index.map=ORCL.SOE.LOGON:soe.logon
If you don't do this you'll get an InvalidIndexNameException. You also need to add
topic.key.ignore = ORCL.SOE.LOGON
Note that the global key.ignore is currently ignored if you are also overriding another topic parameter. If you don't set this flag for the topic, you'll get org.apache.kafka.connect.errors.DataException: STRUCT is not supported as the document id..
Now we can run our connector. I'm setting the CLASSPATH necessary to pick up the connector itself, as well as the dependecies. I also set JMX_PORT so that the metrics are exposed on JMX for helping with debug/monitoring.
export CLASSPATH=/opt/kafka-connect-elasticsearch/*
export JMX_PORT=4243
/usr/bin/connect-standalone /etc/kafka/connect-standalone.properties /opt/elasticsearch-2.4.0/config/elasticsearch-kafka-connect.properties
You'll not get much from the console after the initial flurry of activity, except:
[pool-2-thread-1] INFO org.apache.kafka.connect.runtime.WorkerSinkTask - WorkerSinkTask{id=elasticsearch-sink-0} Committing offsets
But if you head over to Elasticsearch you should now have some data. In Kopf you'll see that there are now 'documents' in the index:
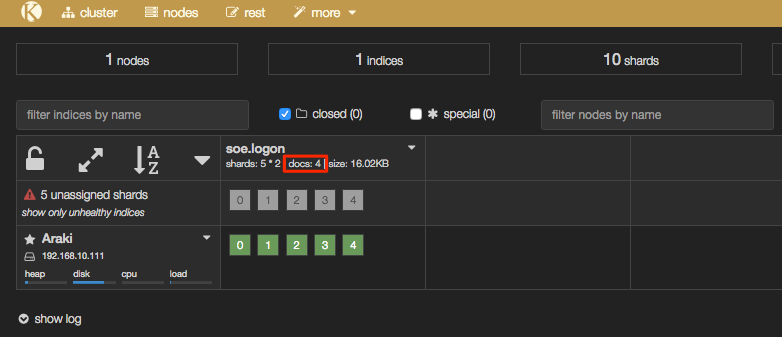
In addition the header bar of Kopf has gone a yellow/gold colour, because your Elasticsearch cluster is now in "YELLOW" state - we'll come back to this and the cause (unassigned shards) shortly.
Interactions with Elasticsearch are primarily through a REST API, which you can use to query the number of records in an index:
[oracle@bigdatalite ~]$ curl -s -X "GET" "http://localhost:9200/soe.logon/_count?pretty=true"
{
"count" : 4,
"_shards" : {
"total" : 5,
"successful" : 5,
"failed" : 0
}
}
and you can pair it up with jq as above to select just one of the fields:
$ curl -s -X "GET" "http://localhost:9200/soe.logon/_count?pretty=true"|jq '.count'
4
To see the data itself:
$ curl -s -X "GET" "http://localhost:9200/soe.logon/_search?pretty=true"
{
"took" : 25,
"timed_out" : false,
"_shards" : {
"total" : 5,
"successful" : 5,
"failed" : 0
},
"hits" : {
"total" : 4,
"max_score" : 1.0,
"hits" : [ {
"_index" : "soe.logon",
"_type" : "kafka-connect",
"_id" : "ORCL.SOE.LOGON+0+3",
"_score" : 1.0,
"_source" : {
"table" : "ORCL.SOE.LOGON",
"op_type" : "I",
"op_ts" : "2016-09-05 14:46:16.000436",
"current_ts" : "2016-09-05 15:46:21.860000",
"pos" : "00000000000000002748",
"LOGON_ID" : 42.0,
"CUSTOMER_ID" : 42.0,
"LOGON_DATE" : "2016-09-05:15:46:11"
}
},
This is looking good! But ... there's a wrinkle. Let's fire up Kibana, an analytical tool for data in Elasticsearch, and see why.
/opt/kibana-4.6.0-linux-x86_64/bin/kibana
Go to http://<server>:5601/ and the first thing you'll see (assuming this is the first time you've run Kibana) is this:
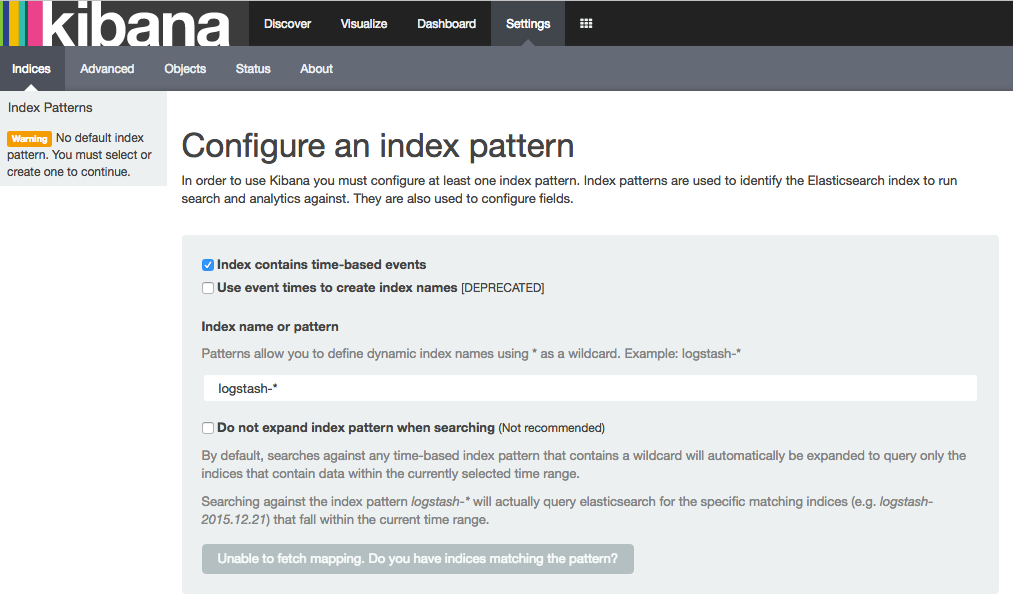
Elasticseach, Index Mappings, and Dynamic Templates
Kibana is a pretty free-form analysis tool, and you don't have to write SQL, define dimensions, and so on -- but what you do have to do is tell it where to find the data. So let's specify our index name, which in this example is soe.logon:
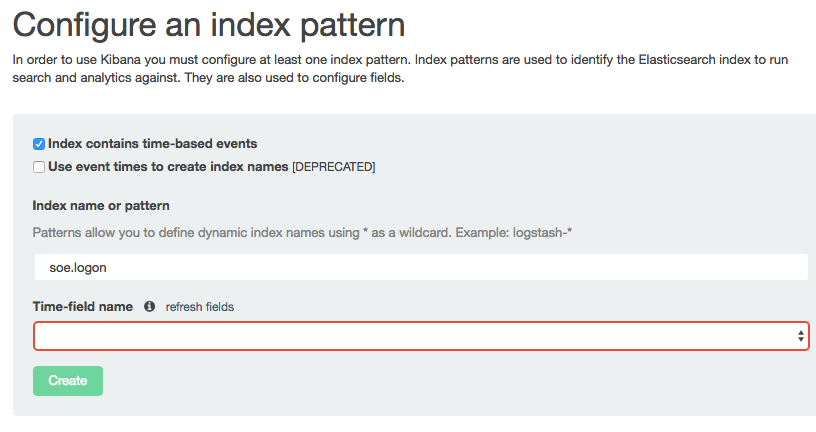
Note that the Time-field name remains blank. If you untick Index contains time-based events and then click Create you'll see the index fields and their types:
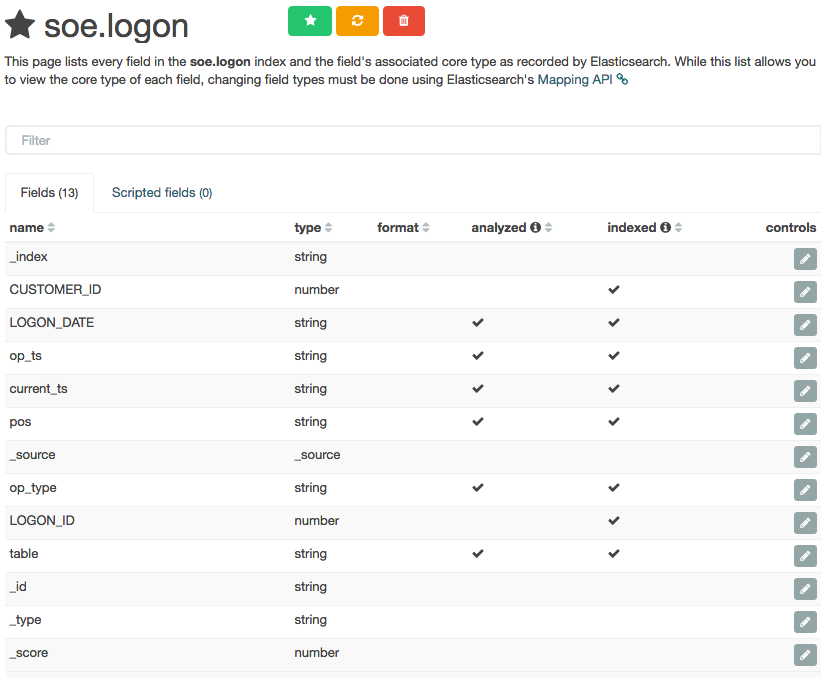
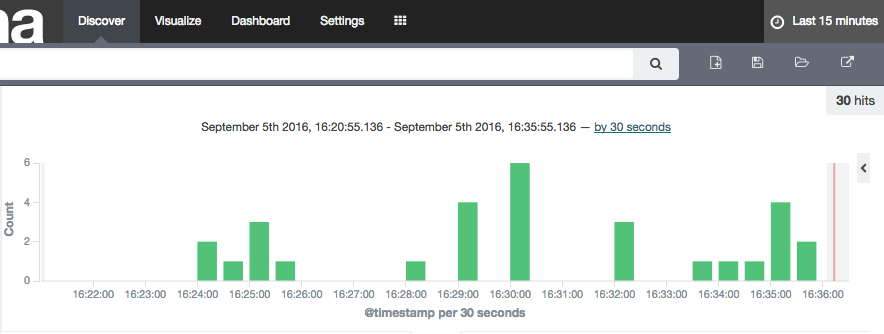
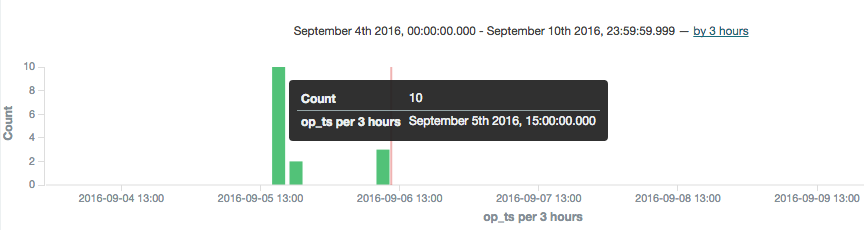
Columns that are timestamps are coming across as strings - which is an issue here, because Time is one of the dimensions by which we'll pretty much always want to analyse data, and if it's not present Kibana (or any other user of the Elasticsearch data) can't do its clever time-based filtering and aggregation, such as this example taken from another (time-based) Elasticsearch index:
As a side note, the schema coming through from OGG Kafka Connect connector is listing these timestamp fields as strings, as we can see with a bit of fancy jq processing to show the schema entry for one of the fields (op_ts):
$ kafka-console-consumer --zookeeper localhost:2181 --topic ORCL.SOE.LOGON --from-beginning --max-messages 1|jq '.schema.fields[] | select (.field | contains("op_ts"))'
{
"field": "op_ts",
"optional": false,
"type": "string"
}
This string-based schema is actually coming through from the OGG replicat itself - whilst the Kafka Connect handler interprets and assumes the datatypes of columns such as numbers, it doesn't for timestamps.
So - how do we fix these data types in Elasticsearch so that we can make good use of the data? Enter Dynamic Templates. These enable you to specify the mapping (similar to a schema) of an index prior to it being created for a field for the first time, and you can wildcard field names too so that, for example, anything with a _ts suffix is treated as a timestamp data type.
To configure the dynamic template we'll use the REST API again, and whilst curl is fine for simple and repeated command line work, we'll switch to the web-based Elasticsearch REST API client, Sense. Assuming that you installed it following the process above you can access it at http://<server>:5601/app/sense.
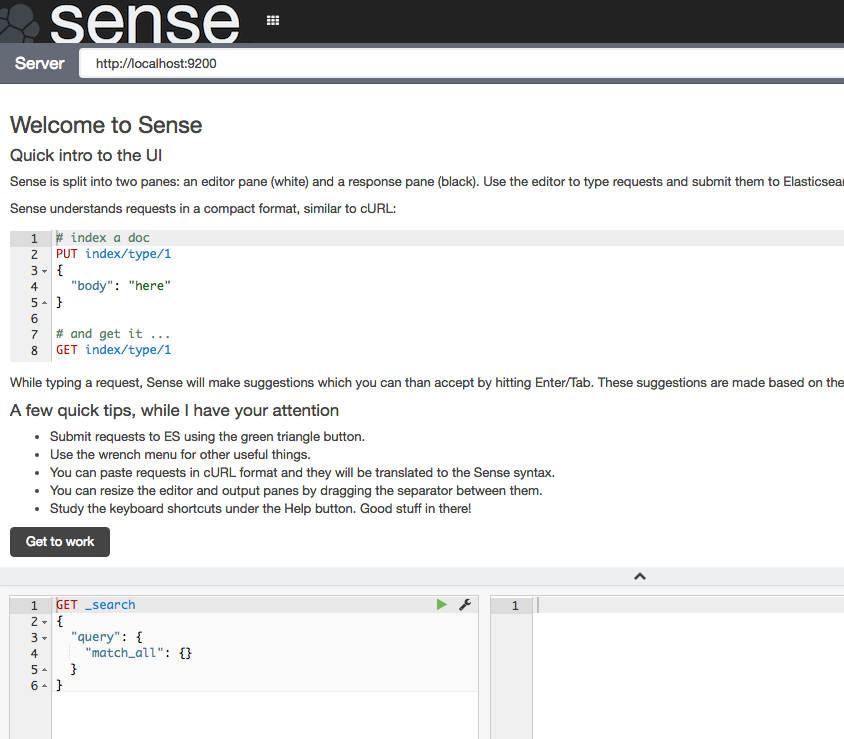
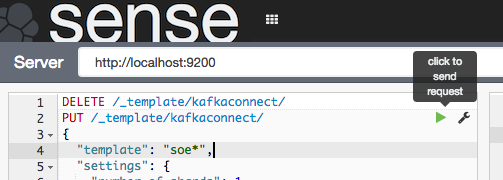
Click Get to work to close the intro banner, and in the main editor paste the following JSON (gist here)
DELETE /_template/kafkaconnect/
PUT /_template/kafkaconnect/
{
"template": "soe*",
"settings": {
"number_of_shards": 1,
"number_of_replicas": 0
},
"mappings": {
"_default_": {
"dynamic_templates": [
{
"dates": {
"match": "*_ts",
"mapping": {
"type": "date",
"format": "YYYY-MM-dd HH:mm:ss.SSSSSS"
}
}
},
{
"non_analysed_string_template": {
"match": "*",
"match_mapping_type": "string",
"mapping": {
"type": "string",
"index": "not_analyzed"
}
}
}
]
}
}
}
What this is doing:
- The
DELETEis just there so that you can re-run these statements, since Elasticsearch won't update an existing template. - Any index beginning with
soewill be matched against this template. - This is based on a single-node Elasticsearch instance, so setting the number of replicas to zero, and shards to one. In a multi-node Production cluster you'd want to set these differently. If you leave replicas as the default (1) then your Elasticsearch cluster will remain in "YELLOW" health status as there'll forever be unassigned shards.
- The
datestemplate matches any field with_tssuffix and sets it to a Date type. The inbound data must match the format shown. For details of the date format specifics, see the JodaTime documentation. - The
non_analysed_string_templatetemplate matches any string field and creates two instances of it; one analyzed and one not. Analyzed is where it gets tokenized which is useful for full-text searching etc, and non-analyzed is necessary for aggregations against the full field value. For example, "New York" would otherwise aggregate as 'New' and a separate instance 'York'.
Put the cursor over each statement and click the green play arrow that appears to the right of the column.
For the DELETE statement you'll get an error the first time it's run (because the index template isn't there to delete), and the PUT should succeed with
{
"acknowledged": true
}
Now we'll delete the index itself so that it can be recreated and pick up the dynamic mappings. Here I'm using curl but you can run this in Sense too if you want.
$ curl -X "DELETE" "http://localhost:9200/soe.logon"
{"acknowledged":true}
Watch out here, because Elasticsearch will delete an index before you can say 'oh sh....' -- there is no "Are you sure you want to drop this index?" type interaction. You can even wildcard the above REST request for real destruction and mayhem - action.destructive_requires_name can be set to limit this risk.
So, to recap - we've successfully run Kafka Connect to load data from a Kafka topic into an Elasticsearch index. We've taken that index and seen that the field mappings aren't great for timestamp fields, so have defined a dynamic template in Elasticsearch so that new indices created will set any column ending _ts to a timestamp. Finally, we deleted the existing index so that we can use the new template from now on.
Let's test out the new index mapping. Since we deleted the index that had our data in (albeit test data) we can take advantage of the awesomeness that is Kafka by simply replaying the topic from the start. To do this change the name value in the Elasticsearch connector configuration (elasticsearch-kafka-connect.properties), e.g. add a number to its suffix:
name=elasticsearch-sink-01
If you're running Kafka Connect in standalone mode then you could also just delete the offsets file to achieve the same.
Whilst in the configuration file you need to also add another entry, telling the connector to ignore the schema that is passed from Kafka and instead dynamically infer the types (as well as honour the dynamic mappings that we specified)
topic.schema.ignore=ORCL.SOE.LOGON
Now restart the connector (make sure you did delete the Elasticsearch index per above, otherwise you'll see no difference in the mappings)
export CLASSPATH=/opt/kafka-connect-elasticsearch/*
export JMX_PORT=4243
/usr/bin/connect-standalone /etc/kafka/connect-standalone.properties /opt/elasticsearch-2.4.0/config/elasticsearch-kafka-connect.properties
And go check out Elasticsearch, first the mapping:
$ curl -X "GET" "http://localhost:9200/soe.logon/_mapping?pretty"
{
"soe.logon" : {
"mappings" : {
[...]
"LOGON_ID" : {
"type" : "double"
},
"current_ts" : {
"type" : "date",
"format" : "YYYY-MM-dd HH:mm:ss.SSSSSS"
},
"op_ts" : {
"type" : "date",
"format" : "YYYY-MM-dd HH:mm:ss.SSSSSS"
[...]
Note that the two timestamp columns are now date type. If you still see them as strings, make sure you've set the topic.schema.ignore configuration as shown above in the Kafka Connect properties for the Elasticsearch connector.
Looking at the row count, we can see that all the records from the topic have been successfully replayed from Kafka and loaded into Elasticsearch. This ability to replay data on demand whilst developing and testing the ingest into a subsequent pipeline is a massive benefit of using Kafka!
$ curl -s -X "GET" "http://localhost:9200/soe.logon/_count?pretty=true"|jq '.count'
16
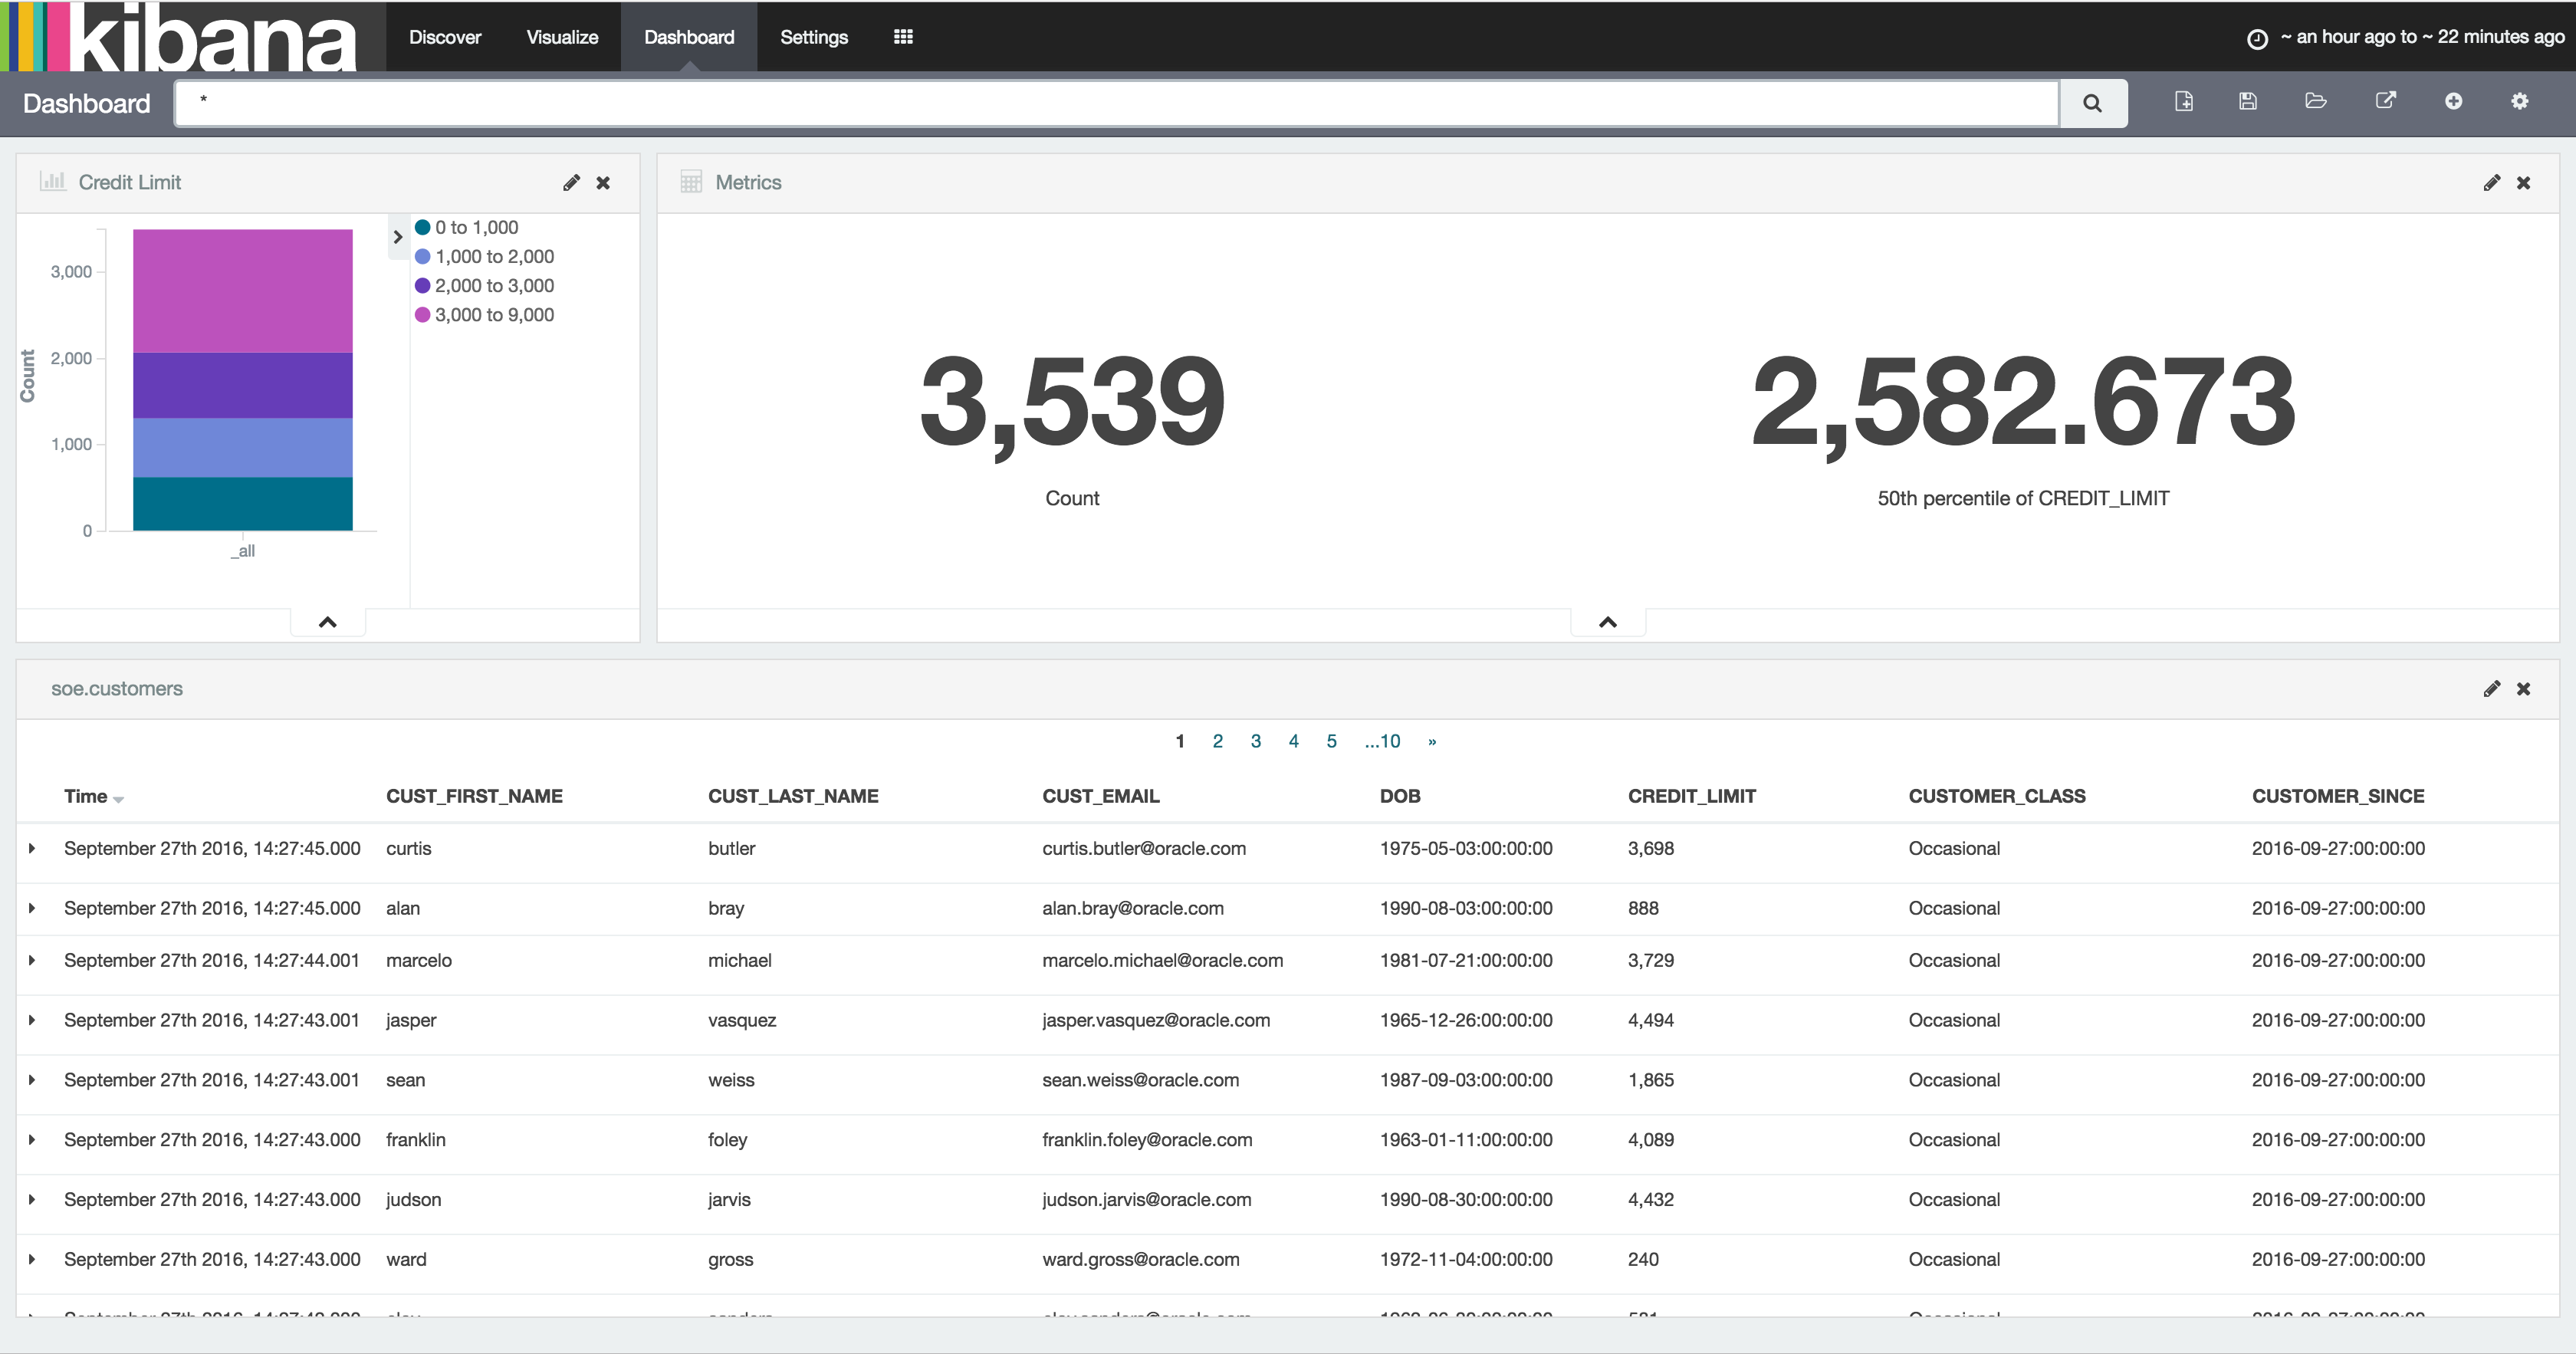
Over in Kibana head to the Index Patterns setting page (http://<server>:5601/app/kibana#/settings/indices), or from the Settings -> Indices menu buttons at the top. If you already have the index defined here then delete it - we want Kibana to pick up the new shiny version we've created because it includes the timestamp columns. Now configure a new index pattern:
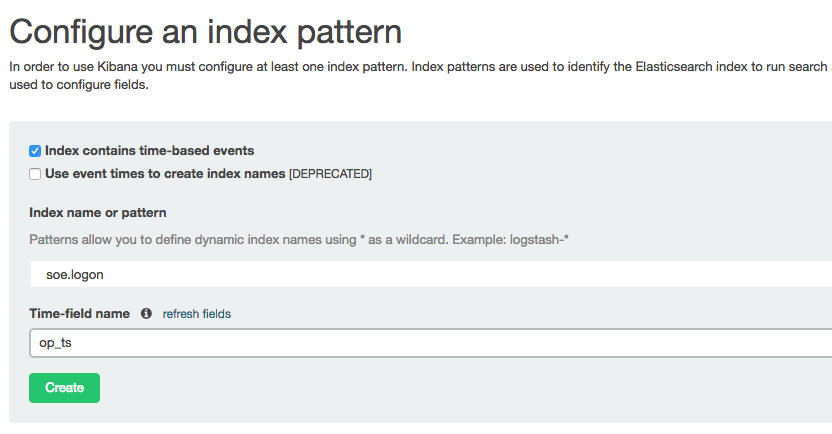
Note that the Time-field name field is now populated. I've selected op_ts. Click on Create and then go to the Discover page (from the option at the top of the page). You may well see "No results found" - if so use the button in the top-right of the page to change the time window to broaden it to include the time at which you inserted record(s) to the SOE.LOGON table in the testing above.
To explore the data further you can click on the add button that you get when hovering over each of the fields on the left of the page, which will add them as columns to the main table, replacing the default _source (which shows all fields):
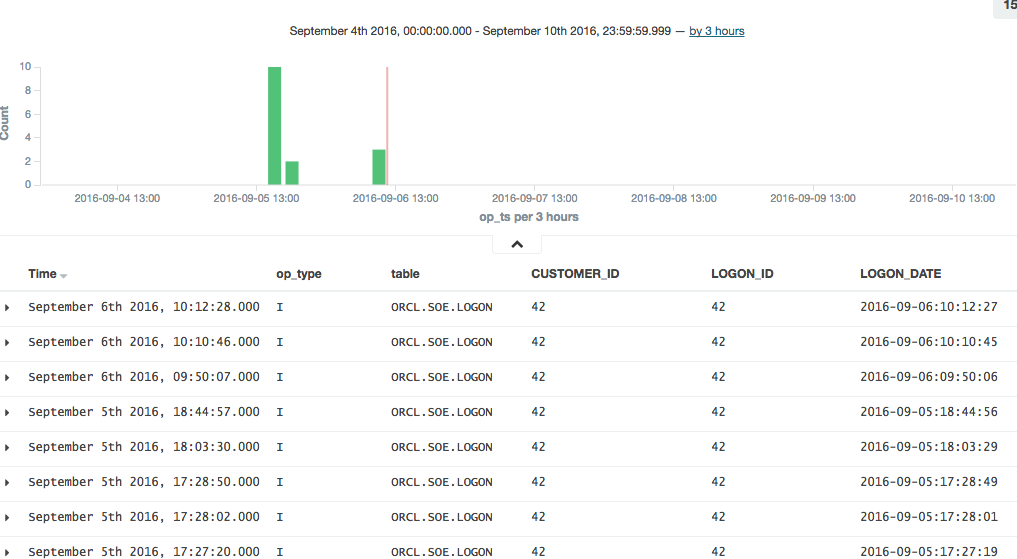
In this example you can see that there was quite a few testing records inserted (op_type = I), with nothing changing between than the LOGON_DATE.
Connector errors after adding dynamic templates
Note that if you get an error like this when running the connector:
[pool-2-thread-1] ERROR org.apache.kafka.connect.runtime.WorkerSinkTask - Task elasticsearch-sink-02-0 threw an uncaught and unrecoverable exception
org.apache.kafka.connect.errors.ConnectException: Cannot create mapping:{"kafka-connect":{"properties":{"[...]
at io.confluent.connect.elasticsearch.Mapping.createMapping(Mapping.java:65)
then check the Elasticsearch log/stdout, where you'll find more details. This kind of thing that can cause problems would be an index not deleted before re-running it with the new template, as well as a date format in the template that doesn't match the data.
Running a Full Swingbench Test
Configuration
If you've made it this far, congratulations! Now we're going to set up the necessary configuration to run Swingbench. This will generate a stream of changes to multiple tables, enabling us to get a feel for how the pipeline behaves in 'real world' conditions.
To start will, let's get a list of all the tables involved:
$ rlwrap sqlplus soe/soe@orcl
SQL*Plus: Release 12.1.0.2.0 Production on Tue Sep 6 11:45:02 2016
Copyright (c) 1982, 2014, Oracle. All rights reserved.
Last Successful login time: Fri Sep 02 2016 15:49:03 +01:00
Connected to:
Oracle Database 12c Enterprise Edition Release 12.1.0.2.0 - 64bit Production
With the Partitioning, OLAP, Advanced Analytics and Real Application Testing options
SQL> select table_name from user_tables;
TABLE_NAME
--------------------------------------------------------------------------------
WAREHOUSES
PRODUCT_INFORMATION
PRODUCT_DESCRIPTIONS
ORDER_ITEMS
ORDERS
ORDERENTRY_METADATA
LOGON
INVENTORIES
CUSTOMERS
CARD_DETAILS
ADDRESSES
11 rows selected.
SQL>
The OGG replication is already defined with a wildcard, to pick up all tables in the SOE schema:
[oracle@bigdatalite config]$ cat /u01/ogg/dirprm/ext1.prm
EXTRACT EXT1
USERID SYSTEM, PASSWORD welcome1
EXTTRAIL ./dirdat/lt
SOURCECATALOG ORCL
TABLE SOE.*;
[oracle@bigdatalite config]$ cat /u01/ogg-bd/dirprm/rconf.prm
REPLICAT rconf
TARGETDB LIBFILE libggjava.so SET property=dirprm/conf.props
REPORTCOUNT EVERY 1 MINUTES, RATE
GROUPTRANSOPS 1000
MAP *.*.*, TARGET *.*.*;
The OGG Kafka Connect handler will automatically create a topic for every table that it receives from OGG. So all we need to do now is add each table to the Elasticsearch Sink configuration. For this, I created a second version of the configuration file, at /opt/elasticsearch-2.4.0/config/elasticsearch-kafka-connect-full.properties
name=elasticsearch-sink-full-00
connector.class=io.confluent.connect.elasticsearch.ElasticsearchSinkConnector
tasks.max=1
connection.url=http://localhost:9200
type.name=kafka-connect
topics=ORCL.SOE.WAREHOUSES ,ORCL.SOE.PRODUCT_INFORMATION ,ORCL.SOE.PRODUCT_DESCRIPTIONS ,ORCL.SOE.ORDER_ITEMS ,ORCL.SOE.ORDERS ,ORCL.SOE.ORDERENTRY_METADATA ,ORCL.SOE.LOGON ,ORCL.SOE.INVENTORIES ,ORCL.SOE.CUSTOMERS ,ORCL.SOE.CARD_DETAILS ,ORCL.SOE.ADDRESSES
topic.schema.ignore=ORCL.SOE.WAREHOUSES ,ORCL.SOE.PRODUCT_INFORMATION ,ORCL.SOE.PRODUCT_DESCRIPTIONS ,ORCL.SOE.ORDER_ITEMS ,ORCL.SOE.ORDERS ,ORCL.SOE.ORDERENTRY_METADATA ,ORCL.SOE.LOGON ,ORCL.SOE.INVENTORIES ,ORCL.SOE.CUSTOMERS ,ORCL.SOE.CARD_DETAILS ,ORCL.SOE.ADDRESSES
topic.key.ignore=ORCL.SOE.WAREHOUSES ,ORCL.SOE.PRODUCT_INFORMATION ,ORCL.SOE.PRODUCT_DESCRIPTIONS ,ORCL.SOE.ORDER_ITEMS ,ORCL.SOE.ORDERS ,ORCL.SOE.ORDERENTRY_METADATA ,ORCL.SOE.LOGON ,ORCL.SOE.INVENTORIES ,ORCL.SOE.CUSTOMERS ,ORCL.SOE.CARD_DETAILS ,ORCL.SOE.ADDRESSES
topic.index.map=ORCL.SOE.WAREHOUSES:soe.warehouses ,ORCL.SOE.PRODUCT_INFORMATION:soe.product_information ,ORCL.SOE.PRODUCT_DESCRIPTIONS:soe.product_descriptions ,ORCL.SOE.ORDER_ITEMS:soe.order_items ,ORCL.SOE.ORDERS:soe.orders ,ORCL.SOE.ORDERENTRY_METADATA:soe.orderentry_metadata ,ORCL.SOE.LOGON:soe.logon ,ORCL.SOE.INVENTORIES:soe.inventories ,ORCL.SOE.CUSTOMERS:soe.customers ,ORCL.SOE.CARD_DETAILS:soe.card_details ,ORCL.SOE.ADDRESSES:soe.addresses
Having created the configuration, run the connector. If the previous connector from the earlier testing is running then stop it first, otherwise you'll get a port clash (and be double-processing the ORCL.SOE.LOGON topic).
/usr/bin/connect-standalone /etc/kafka/connect-standalone.properties /opt/elasticsearch-2.4.0/config/elasticsearch-kafka-connect-full.properties
Running Swingbench
I'm using charbench which is a commandline interface for Swingbench:
$ /opt/swingbench/bin/charbench -cs localhost:1521/orcl -u soe -p soe -v trans,users
Author  :        Dominic Giles
Version :        2.5.0.971

Results will be written to results.xml.
Hit Return to Terminate Run...

Time            NCR     UCD     BP      OP      PO      BO      SQ      WQ      WA      Users
06:59:14        0       0       0       0       0       0       0       0       0       [0/1]
06:59:15        0       0       0       0       0       0       0       0       0       [0/1]
06:59:16        0       0       0       0       0       0       0       0       0       [0/1]
06:59:17        0       0       0       0       0       0       0       0       0       [0/1]
06:59:18        0       0       0       0       0       0       0       0       0       [0/1]
06:59:19        0       0       0       0       0       0       0       0       0       [0/1]
06:59:20        0       0       0       0       0       0       0       0       0       [0/1]
06:59:21        0       0       0       0       0       0       0       0       0       [0/1]
06:59:22        0       0       0       0       0       0       0       0       0       [1/1]
06:59:23        2       0       2       0       0       0       0       0       0       [1/1]
06:59:24        3       0       4       5       0       0       0       0       0       [1/1]
Each of the columns with abbreviated headings are different transactions run, and as soon as you see numbers above zero in them it indicates that you should be getting data in the Oracle tables, and thus through into Kafka and Elasticsearch.
Auditing the Pipeline
Let's see how many records are on the ORDERS table:
$ rlwrap sqlplus soe/soe@orcl

SQL*Plus: Release 12.1.0.2.0 Production on Tue Sep 6 12:21:13 2016

Copyright (c) 1982, 2014, Oracle.  All rights reserved.

Last Successful login time: Tue Sep 06 2016 12:21:09 +01:00

Connected to:
Oracle Database 12c Enterprise Edition Release 12.1.0.2.0 - 64bit Production
With the Partitioning, OLAP, Advanced Analytics and Real Application Testing options

SQL> select count(*) from orders;

COUNT(*)
----------
143001
But, this includes the records that were pre-seeded by Swingbench before we set up the OGG extract. How do we know how many have been read by GoldenGate since, and should therefore be downstream on Kafka, and Elasticsearch? Enter logdump. This is a GoldenGate tool that gives a commandline interface to analysing the OGG trail file itself. You can read more about it here, here, and here.
First, determine the trail file name:
$ ls -l /u01/ogg/dirdat/*
-rw-r-----. 1 oracle oinstall 64068 Sep  9 10:16 /u01/ogg/dirdat/lt000000015
And then launch logdump (optionally, but preferably, with rlwrap to give command history and search):
$ cd /u01/ogg/
$ rlwrap ./logdump
From the Logdump > prompt, open the trail file:
Logdump 1 >OPEN /u01/ogg/dirdat/lt000000015
Current LogTrail is /u01/ogg/dirdat/lt000000015
and then filter to only show records relating to the table we're interested in:
Logdump 2 >FILTER FILENAME ORCL.SOE.ORDERS
and then give a summary of the records present:
Logdump 3 >COUNT
LogTrail /u01/ogg/dirdat/lt000000015 has 46 records
Total Data Bytes              14056
  Avg Bytes/Record              305
Insert                           22
Update                           23
Metadata Records                  1
After Images                     45
Filtering matched           46 records
          suppressed       208 records
Here we can see that there are a total of 45 insert/update records that have been captured.
Let's check the replicat's trail file also matches:
$ ls -l /u01/ogg-bd/dirdat/*
-rw-r-----. 1 oracle oinstall 64416 Sep  9 10:16 /u01/ogg-bd/dirdat/rt000000000

$ cd /u01/ogg-bd
$ rlwrap ./logdump

Oracle GoldenGate Log File Dump Utility
Version 12.2.0.1.160419 OGGCORE_12.2.0.1.0OGGBP_PLATFORMS_160430.1401

Copyright (C) 1995, 2016, Oracle and/or its affiliates. All rights reserved.


Logdump 1 >OPEN /u01/ogg-bd/dirdat/rt000000000
Current LogTrail is /u01/ogg-bd/dirdat/rt000000000
Logdump 2 >FILTER FILENAME ORCL.SOE.ORDERS
Logdump 3 >COUNT
LogTrail /u01/ogg-bd/dirdat/rt000000000 has 46 records
Total Data Bytes              14056
  Avg Bytes/Record              305
Insert                           22
Update                           23
Metadata Records                  1
After Images                     45
Filtering matched           46 records
          suppressed       213 records

Average of 3 Transactions
Bytes/Trans .....       5421
Records/Trans ...         15
Files/Trans .....          4
Looks good - a total of 45 records again.
So from OGG, the data flows via the Kafka Connect connect into a Kafka topic, one per table. We can count how many messages there are on the corresponding Kafka topic by running a console consumer, redirecting the messages to file (and using & to return control to the console):
$ kafka-console-consumer --zookeeper localhost:2181 --topic ORCL.SOE.ORDERS --from-beginning > /tmp/kafka_orcl.soe.orders &
and then issue a wc to count the number of lines currently in the resulting file:
$  wc -l /tmp/kafka_orcl.soe.orders
45 /tmp/kafka_orcl.soe.orders
Since the console consumer process is still running in the background (type fg to bring it back to the foreground if you want to cancel it), you can re-issue the wc as required to see the current count of messages on the topic.
Finally, to see the number of documents on the corresponding Elasticsearch index:
$ curl -s -X "GET" "http://localhost:9200/soe.orders/_count?pretty=true"|jq '.count'
45
Here we've proved that the number of records written by Oracle are making it all the way through our pipeline.
Monitoring the Pipeline
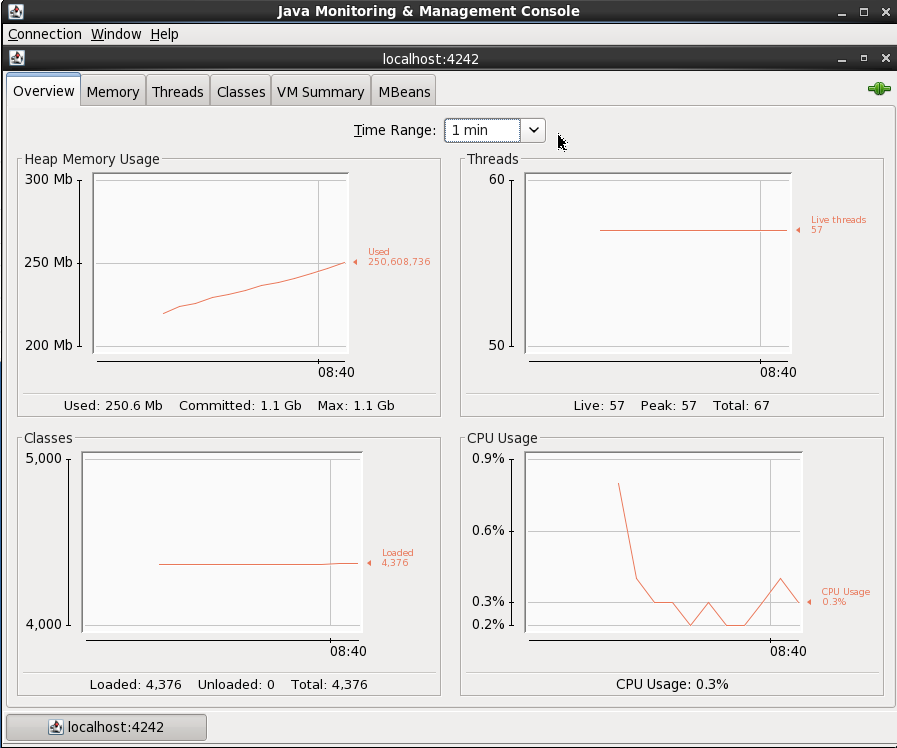
Kafka and Kafka Connect expose metrics through JMX. There's a variety of tools for capturing, persisting, and visualising this, such as detailed here. For now, we'll just use JConsole to inspect the metrics and get an idea of what's available.
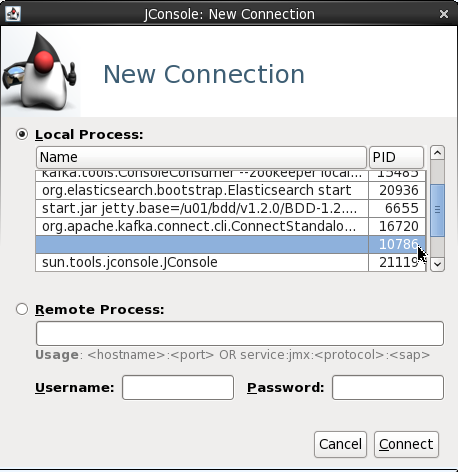
You'll need a GUI for jconsole, so either a desktop session on the server itself, X11 forwarded, or you can also run JConsole from a local machine (it's bundled with any JDK) and connect to the remote JMX. In this example I simply connected to the VM's desktop and ran JConsole locally there. You launch it by running it from the shell prompt:
$ jconsole
From here I connected to the 'Remote Process' on localhost:4242 to access the Kafka server process (because it's running as root the jconsole process (running as a non-root user) can't connect to it as a 'Local Process'). The port 4242 is what I specified as an environment variable as part of the kafka process launch.
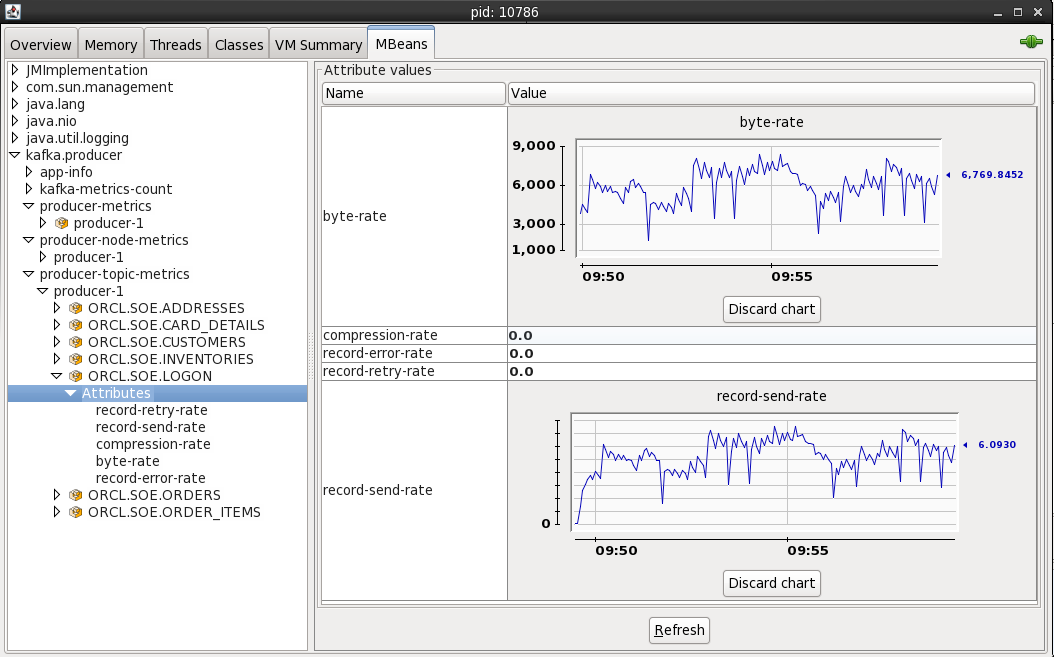
On the MBeans tab there are a list of MBeans under which the bespoke application metrics (as opposed to JVM ones like heap memory usage) are found. For example, the rate at which data is being received and sent from the cluster:
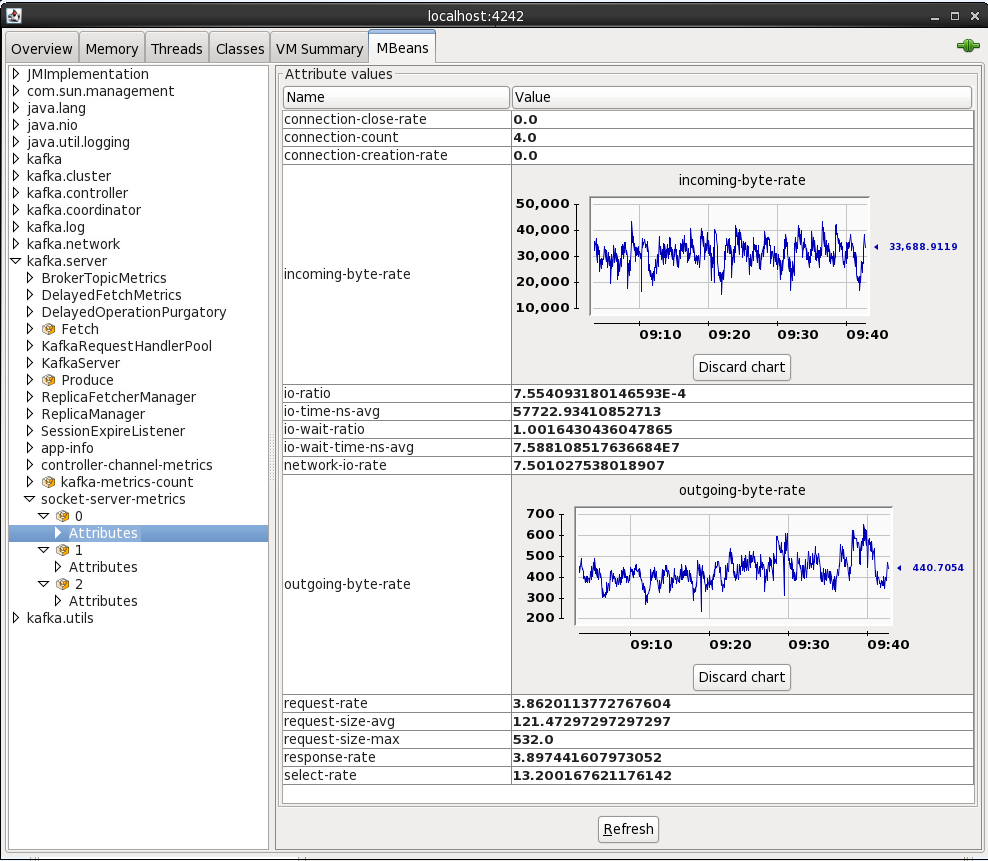
By default when you see an attribute for an MBean is it point-in-time - doubleclick on it to make it a chart that then tracks subsequent changes to the number.
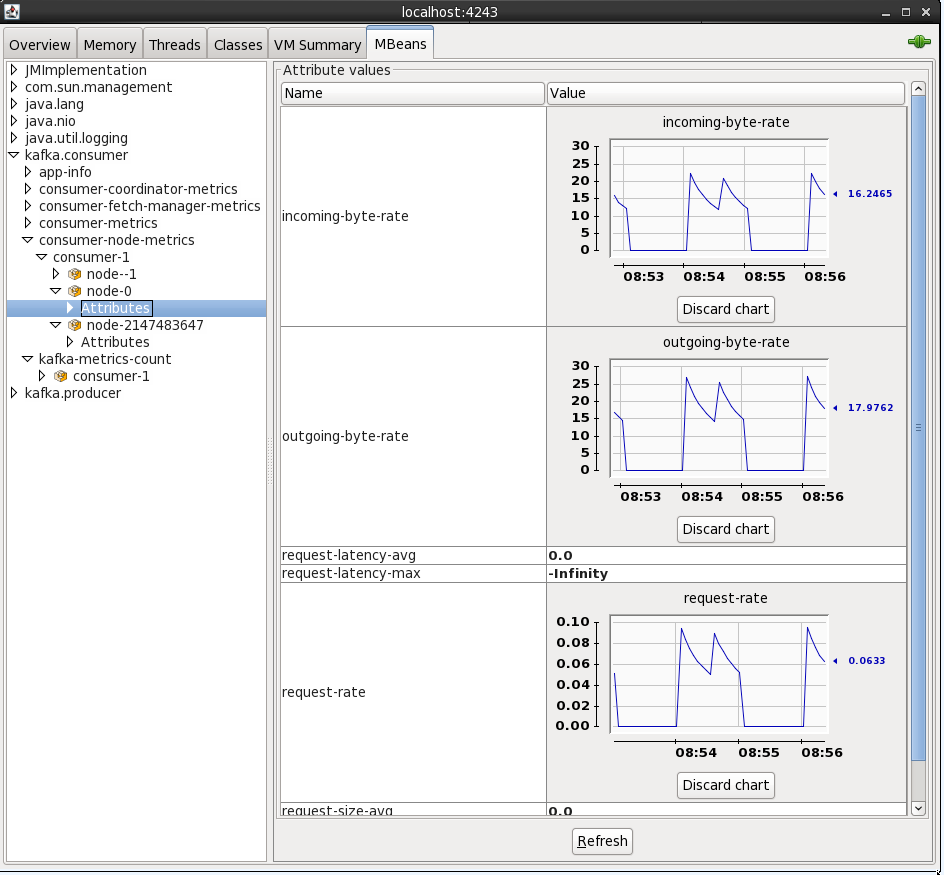
By connecting to localhost:4243 (press Ctrl-N for a new connection in the same JConsole instance) you can inspect the metrics from the Kafka Connect elasticsearch sink
You can also access JMX metrics for the OGG Kafka handler by connecting to the local processs (assuming you're running JConsole locally). To find the PID for the RCONF replicat, run:
$ pgrep -f RCONF
Then select that PID from the JConsole connection list - note that the process name may show as blank.
The producer stats show metrics such as the rate at which topic is being written to:
Conclusion
In this article we've seen how stream transactions from a RDBMS such as Oracle into Kafka and out to a target such as Elasticsearch, utilising the Kafka Connect platform and its standardised connector framework. We also saw how to validate and audit the pipeline at various touchpoints, as well as a quick look at accessing the JMX metrics that Kafka provides.
This article was also posted on the Confluent blog, head over there for more great Kafka-related content!
Using logdump to Troubleshoot the Oracle GoldenGate for Big Data Kafka handler
Oracle GoldenGate for Big Data (OGG BD) supports sending transactions as messages to Kafka topics, both through the native Oracle handler as well as a connector into Confluent's Kafka Connect. In some research that I was doing with it I found an interesting problem that I am going to demonstrate here and show the troubleshooting tools that may be useful to others encountering similar issues.
The source for the data is Swingbench running against Oracle 12c database (pluggable instance). OGG has been configured as follows:
Extract
EXTRACT EXT1
USERID SYSTEM, PASSWORD welcome1
EXTTRAIL ./dirdat/lt
SOURCECATALOG ORCL
TABLE SOE.*;
Datapump (to local machine, an installation of OGG BD)
EXTRACT EXTDP1
RMTHOST LOCALHOST, MGRPORT 7810
RMTTRAIL ./dirdat/rt
SOURCECATALOG ORCL
TABLE SOE.*;
Replicat
REPLICAT rkafka
TARGETDB LIBFILE libggjava.so SET property=dirprm/kafka.props
REPORTCOUNT EVERY 1 MINUTES, RATE
GROUPTRANSOPS 10000
MAP *.*.*, TARGET *.*.*;
When I start the replicat, it abends almost straight away. In ggserr.log I see:
ERROR   OGG-15051  Oracle GoldenGate Delivery, rkafka.prm:  Java or JNI exception:
oracle.goldengate.util.GGException: Kafka Handler failed to format and process operation: table=[ORCL.SOE.CUSTOMERS], op pos=00000000000000006636, tx pos=00000000000000002437, op ts=2016-09-06 10:59:23.000589.
ERROR   OGG-01668  Oracle GoldenGate Delivery, rkafka.prm:  PROCESS ABENDING.
Within the properties file for the Kafka handler (dirprm/kafka.props) I increased the logging level
gg.log.level=DEBUG
and restart the replicat. Now we get a debug file written to dirrpt/RKAFKA_debug_log4j.log which includes successful work:
[...]
[main] DEBUG (UserExitDataSource.java:1190) - Received txInd is: WHOLE RBA is: 4939
[main] DEBUG (KafkaHandler.java:484) - Process operation: table=[ORCL.SOE.LOGON], op pos=00000000000000004939, tx pos=00000000000000002437, op ts=2016-09-06 10:59:23.000179
[main] DEBUG (KafkaHandler.java:529) - Creating the producer record and sending to Kafka Producer
[main] DEBUG (NonBlockingKafkaProducer.java:64) - Sending producer record to Non Blocking kafka producer
[main] DEBUG (NonBlockingKafkaProducer.java:76) - NBKP:send(): Returning status: OK
[main] DEBUG (PendingOpGroup.java:316) - now ready to checkpoint? false (was ready? false): {pendingOps=18, groupSize=0, timer=0:00:00.000 [total = 0 ms ]}
[main] DEBUG (UserExitDataSource.java:1401) - applyQueuedConfigurationChanges: on Operation? false
[main] DEBUG (UserExitDataSource.java:2342) - UpdateActivityTime call received
[...]
but then a failure, matching the more high-level message we got previously in ggserr.log:
DEBUG 2016-09-06 15:50:52,909 [main] DEBUG (KafkaHandler.java:484) - Process operation: table=[ORCL.SOE.CUSTOMERS], op pos=00000000000000006636, tx pos=00000000000000002437, op ts=2016-09-06 10:59:23.000589
INFO 2016-09-06 15:50:52,910 [main] INFO  (AvroOperationSchemaGenerator.java:36) - Generating the Avro schema for the table [ORCL.SOE.CUSTOMERS].
ERROR 2016-09-06 15:50:52,914 [main] ERROR (AvroOperationFormatter.java:188) - The Avro Formatter formatOp operation failed.
org.apache.avro.SchemaParseException: Illegal character in: SYS_NC00017$
    at org.apache.avro.Schema.validateName(Schema.java:1083)
    at org.apache.avro.Schema.access$200(Schema.java:79)
    at org.apache.avro.Schema$Field.<init>(Schema.java:372)
    at org.apache.avro.SchemaBuilder$FieldBuilder.completeField(SchemaBuilder.java:2124)
    at org.apache.avro.SchemaBuilder$FieldBuilder.completeField(SchemaBuilder.java:2116)
    at org.apache.avro.SchemaBuilder$FieldBuilder.access$5300(SchemaBuilder.java:2034)
So from this we've got the table (ORCL.SOE.CUSTOMERS), log offset (6636), and from the stack trace even a hint at what the issue may be (something to do with the Schema, and a column called SYS_NC00017$).
Now let's see if we can find out more. A colleague of mine pointed me towards Logdump, which is well documented and also covered by Oracle's A-Team blog here.
Launch logdump from the OGG BD folder, ideally using rlwrap so that you can scroll and search through command history:
$ rlwrap ./logdump

Oracle GoldenGate Log File Dump Utility
Version 12.2.0.1.160419 OGGCORE_12.2.0.1.0OGGBP_PLATFORMS_160430.1401

Copyright (C) 1995, 2016, Oracle and/or its affiliates. All rights reserved.


Logdump 1 >
Then enter the following, which will determine what information is shown:
Show record headers
GHDR ONShow detailed column data, in both hex and ASCII
DETAIL ON
DETAIL DATA
After that, specify the trail file to be examined:
OPEN /u01/ogg-bd/dirdat/rt000000000
You can enter next (or simply n) to view the records one at a time:
Logdump 6 >OPEN /u01/ogg-bd/dirdat/rt000000000
Current LogTrail is /u01/ogg-bd/dirdat/rt000000000
Logdump 7 >n

2016/09/02 15:54:48.329.147 FileHeader           Len  1451 RBA 0
Name: *FileHeader*
3000 0338 3000 0008 4747 0d0a 544c 0a0d 3100 0002 | 0..80...GG..TL..1...
0005 3200 0004 2000 0000 3300 0008 02f2 61ba f7c1 | ..2... ...3.....a...
f3bb 3400 002d 002b 7572 693a 6269 6764 6174 616c | ..4..-.+uri:bigdatal
6974 653a 6c6f 6361 6c64 6f6d 6169 6e3a 3a75 3031 | ite:localdomain::u01
3a6f 6767 3a45 5854 4450 3135 0000 2f35 0000 2b00 | :ogg:EXTDP15../5..+.
2975 7269 3a62 6967 6461 7461 6c69 7465 3a6c 6f63 | )uri:bigdatalite:loc
616c 646f 6d61 696e 3a3a 7530 313a 6f67 673a 4558 | aldomain::u01:ogg:EX

Logdump 8 >n
-------------------------------------------------------------------
Hdr-Ind    :     E  (x45)     Partition  :     .  (x00)
UndoFlag   :     .  (x00)     BeforeAfter:     A  (x41)
RecLength  :     0  (x0000)   IO Time    : 2016/09/02 15:54:47.562.301
IOType     :   151  (x97)     OrigNode   :     0  (x00)
TransInd   :     .  (x03)     FormatType :     R  (x52)
SyskeyLen  :     0  (x00)     Incomplete :     .  (x00)
AuditRBA   :          0       AuditPos   : 0
Continued  :     N  (x00)     RecCount   :     0  (x00)

2016/09/02 15:54:47.562.301 RestartOK            Len     0 RBA 1459
Name:
After  Image:                                             Partition 0   G  s

GGS tokens:
4e00 0004 4558 5431                               | N...EXT1
But ploughing through the file a transaction at a time is no fun, so lets zero-in on the problem record. We can either just jump straight to the transaction offset that we got from the error log using POSITION (or POS) followed by NEXT:
Logdump 12 >pos 6636
Reading forward from RBA 6636
Logdump 13 >n
-------------------------------------------------------------------
Hdr-Ind    :     E  (x45)     Partition  :     .  (x0c)
UndoFlag   :     .  (x00)     BeforeAfter:     A  (x41)
RecLength  :   256  (x0100)   IO Time    : 2016/09/06 11:59:23.000.589
IOType     :     5  (x05)     OrigNode   :   255  (xff)
TransInd   :     .  (x00)     FormatType :     R  (x52)
SyskeyLen  :     0  (x00)     Incomplete :     .  (x00)
AuditRBA   :        393       AuditPos   : 30266384
Continued  :     N  (x00)     RecCount   :     1  (x01)

2016/09/06 11:59:23.000.589 Insert               Len   256 RBA 6636
Name: ORCL.SOE.CUSTOMERS  (TDR Index: 3)
After  Image:                                             Partition 12   G  b
0000 000a 0000 0000 0000 0001 86a1 0001 000a 0000 | ....................
0006 616e 7477 616e 0002 000b 0000 0007 7361 6d70 | ..antwan........samp
736f 6e00 0300 0600 0000 0275 7300 0400 0b00 0000 | son........us.......
0741 4d45 5249 4341 0005 000a 0000 0000 0000 0000 | .AMERICA............
8980 0006 001d 0000 0019 616e 7477 616e 2e73 616d | ..........antwan.sam
7073 6f6e 406f 7261 636c 652e 636f 6d00 0700 0a00 | pson@oracle.com.....
0000 0000 0000 0000 9500 0800 1500 0032 3031 362d | ...............2016-
Column     0 (x0000), Len    10 (x000a)
0000 0000 0000 0001 86a1                          | ..........
Column     1 (x0001), Len    10 (x000a)
0000 0006 616e 7477 616e                          | ....antwan
Column     2 (x0002), Len    11 (x000b)
0000 0007 7361 6d70 736f 6e                       | ....sampson
Column     3 (x0003), Len     6 (x0006)
0000 0002 7573                                    | ....us
Column     4 (x0004), Len    11 (x000b)
0000 0007 414d 4552 4943 41                       | ....AMERICA
Column     5 (x0005), Len    10 (x000a)
0000 0000 0000 0000 8980                          | ..........
Column     6 (x0006), Len    29 (x001d)
0000 0019 616e 7477 616e 2e73 616d 7073 6f6e 406f | ....antwan.sampson@o
7261 636c 652e 636f 6d                            | racle.com
Column     7 (x0007), Len    10 (x000a)
0000 0000 0000 0000 0095                          | ..........
Column     8 (x0008), Len    21 (x0015)
0000 3230 3136 2d30 392d 3036 3a30 303a 3030 3a30 | ..2016-09-06:00:00:0
30                                                | 0
Column     9 (x0009), Len    14 (x000e)
0000 000a 4f63 6361 7369 6f6e 616c                | ....Occasional
Column    10 (x000a), Len     9 (x0009)
0000 0005 4d75 7369 63                            | ....Music
Column    11 (x000b), Len    21 (x0015)
0000 3139 3635 2d30 352d 3130 3a30 303a 3030 3a30 | ..1965-05-10:00:00:0
30                                                | 0
Column    12 (x000c), Len     5 (x0005)
0000 0001 59                                      | ....Y
Column    13 (x000d), Len     5 (x0005)
0000 0001 4e                                      | ....N
Column    14 (x000e), Len    10 (x000a)
0000 0000 0000 0002 49f1                          | ........I.
Column    15 (x000f), Len    10 (x000a)
0000 0000 0000 0002 49f1                          | ........I.
or we can also use the FILTER command, but we'll come back to that in a moment. First let's have a look at the record in question that's causing the Kafka handler to abend. It's shown in full above.
The table name matches - ORCL.SOE.CUSTOMERS, and we can see that the operation was an INSERT along with the values for sixteen columns. Now, since we know that the error thrown by the Kafka handler was something to do with schema and columns, let's take a step back. The record we're looking at is the actual data record, but in the trail file will also be metadata about the table itself which will have been read by the handler. We can look for all records in the trail file relating to this table using the FILTER command (preceeded by a POS 0 to move the read back to the beginning of the file):
Logdump 37 >POS 0
Reading forward from RBA 0
Logdump 38 >FILTER INCLUDE FILENAME ORCL.SOE.CUSTOMERS
Logdump 39 >N
-------------------------------------------------------------------
Hdr-Ind    :     E  (x45)     Partition  :     .  (x00)
UndoFlag   :     .  (x00)     BeforeAfter:     A  (x41)
RecLength  :  1464  (x05b8)   IO Time    : 2016/09/06 11:59:26.461.886
IOType     :   170  (xaa)     OrigNode   :     2  (x02)
TransInd   :     .  (x03)     FormatType :     R  (x52)
SyskeyLen  :     0  (x00)     Incomplete :     .  (x00)
DDR/TDR Idx:   (002, 003)     AuditPos   : 30266384
Continued  :     N  (x00)     RecCount   :     1  (x01)

2016/09/06 11:59:26.461.886 Metadata             Len 1464 RBA 5103
Name: ORCL.SOE.CUSTOMERS
*
1)Name          2)Data Type        3)External Length  4)Fetch Offset      5)Scale         6)Level
7)Null          8)Bump if Odd      9)Internal Length 10)Binary Length    11)Table Length 12)Most Sig DT
13)Least Sig DT 14)High Precision  15)Low Precision   16)Elementary Item  17)Occurs       18)Key Column
19)Sub DataType 20)Native DataType 21)Character Set   22)Character Length 23)LOB Type     24)Partial Type
*
TDR version: 1
Definition for table ORCL.SOE.CUSTOMERS
Record Length: 542
Columns: 18
CUSTOMER_ID        134     13        0  0  0 1 0      8      8      8 0 0 0 0 1    0 1   3    2       -1      0 0 0
CUST_FIRST_NAME     64     40       12  0  0 1 0     40     40      0 0 0 0 0 1    0 0   0    1       -1      0 0 0
CUST_LAST_NAME      64     40       58  0  0 1 0     40     40      0 0 0 0 0 1    0 0   0    1       -1      0 0 0
NLS_LANGUAGE        64      3      104  0  0 1 0      3      3      0 0 0 0 0 1    0 0   0    1       -1      0 0 0
NLS_TERRITORY       64     30      112  0  0 1 0     30     30      0 0 0 0 0 1    0 0   0    1       -1      0 0 0
CREDIT_LIMIT       134     11      148  2  0 1 0      8      8      8 0 0 0 0 1    0 0   3    2       -1      0 0 0
CUST_EMAIL          64    100      160  0  0 1 0    100    100      0 0 0 0 0 1    0 0   0    1       -1      0 0 0
ACCOUNT_MGR_ID     134     13      266  0  0 1 0      8      8      8 0 0 0 0 1    0 0   3    2       -1      0 0 0
CUSTOMER_SINCE     192     19      278  0  0 1 0     19     19     19 0 5 0 0 1    0 0   0   12       -1      0 0 0
CUSTOMER_CLASS      64     40      300  0  0 1 0     40     40      0 0 0 0 0 1    0 0   0    1       -1      0 0 0
SUGGESTIONS         64     40      346  0  0 1 0     40     40      0 0 0 0 0 1    0 0   0    1       -1      0 0 0
DOB                192     19      392  0  0 1 0     19     19     19 0 5 0 0 1    0 0   0   12       -1      0 0 0
MAILSHOT            64      1      414  0  0 1 0      1      1      0 0 0 0 0 1    0 0   0    1       -1      0 0 0
PARTNER_MAILSHOT    64      1      420  0  0 1 0      1      1      0 0 0 0 0 1    0 0   0    1       -1      0 0 0
PREFERRED_ADDRESS  134     13      426  0  0 1 0      8      8      8 0 0 0 0 1    0 0   3    2       -1      0 0 0
PREFERRED_CARD     134     13      438  0  0 1 0      8      8      8 0 0 0 0 1    0 0   3    2       -1      0 0 0
SYS_NC00017$        64     40      450  0  0 1 0     40     40      0 0 0 0 0 1    0 0   0    1       -1      0 0 0
SYS_NC00018$        64     40      496  0  0 1 0     40     40      0 0 0 0 0 1    0 0   0    1       -1      0 0 0
End of definition
I spy with my little eye ... SYS_NC00017$, which was named in the debug log that we saw above. Also note:
Columns: 18
So the OGG metadata for the table shows it with eighteen columns, including two SYS_[...]. If you look at the data shown in the record at position 6636 above you'll see that there are only sixteen columns of data. Let's now check out the schema for the table in question in Oracle.
SQL> select COLUMN_NAME,DATA_TYPE from user_tab_columns where table_name = 'CUSTOMERS';

COLUMN_NAME          DATA_TYPE
-------------------- ----------------
PREFERRED_CARD       NUMBER
PREFERRED_ADDRESS    NUMBER
PARTNER_MAILSHOT     VARCHAR2
MAILSHOT             VARCHAR2
DOB                  DATE
SUGGESTIONS          VARCHAR2
CUSTOMER_CLASS       VARCHAR2
CUSTOMER_SINCE       DATE
ACCOUNT_MGR_ID       NUMBER
CUST_EMAIL           VARCHAR2
CREDIT_LIMIT         NUMBER
NLS_TERRITORY        VARCHAR2
NLS_LANGUAGE         VARCHAR2
CUST_LAST_NAME       VARCHAR2
CUST_FIRST_NAME      VARCHAR2
CUSTOMER_ID          NUMBER

16 rows selected.
Sixteen columns. Not eighteen, as the OGG trail file Metadata record showed. Hmmm.
Interestingly, Google throws up a match for this very column in which the output of Dbvisit's replicate tool run against the Swingbench schema announces:
Column SYS_NC00017$ is special: virtual column. Excluding.
Column SYS_NC00017$ is special: hidden column. Excluding.
Column SYS_NC00017$ is special: system-generated column. Excluding.
That it's a hidden column we'd pretty much guessed given its elusiveness. But - virtual column? system generated? This then prompted me to look at the indices on the table:
SQL> SELECT TABLE_NAME, INDEX_NAME, COLUMN_NAME
     FROM USER_IND_COLUMNS
     WHERE TABLE_NAME = 'CUSTOMERS';

TABLE_NAME       INDEX_NAME                       COLUMN_NAME
---------------- -------------------------------- --------------------
CUSTOMERS        CUST_ACCOUNT_MANAGER_IX          ACCOUNT_MGR_ID
CUSTOMERS        CUST_EMAIL_IX                    CUST_EMAIL
CUSTOMERS        CUST_FUNC_LOWER_NAME_IX          SYS_NC00017$
CUSTOMERS        CUST_FUNC_LOWER_NAME_IX          SYS_NC00018$
CUSTOMERS        CUSTOMERS_PK                     CUSTOMER_ID
CUSTOMERS        CUST_DOB_IX                      DOB
Aha! I spy system generated columns! Let's take a closer look at the CUST_FUNC_LOWER_NAME_IX index:
SQL> SELECT INDEX_NAME, INDEX_TYPE
     FROM USER_INDEXES
     WHERE TABLE_NAME = 'CUSTOMERS'
       AND INDEX_NAME='CUST_FUNC_LOWER_NAME_IX';

INDEX_NAME                       INDEX_TYPE
-------------------------------- ---------------------------
CUST_FUNC_LOWER_NAME_IX          FUNCTION-BASED NORMAL
So we have a function-based index, which in the background appears to implement itself via two hidden columns. My guess is that the Kafka handler code is taking the metadata definition record of 18 columns too literally, and expecting to find a value for it in the transaction record when it reads it and falls over when it can't. Similar behaviour happens with the Kafka Connect OGG connector when it tries to process this particular record:
ERROR 2016-08-30 17:25:09,548 [main] ERROR (KafkaConnectFormatter.java:251) - The Kafka Connect Row Formatter formatOp operation failed.
java.lang.IndexOutOfBoundsException: Index: 16, Size: 16
at java.util.ArrayList.rangeCheck(ArrayList.java:653)
at java.util.ArrayList.get(ArrayList.java:429)
at oracle.goldengate.datasource.meta.TableMetaData.getColumnMetaData(TableMetaData.java:73)
at oracle.goldengate.kafkaconnect.formatter.KafkaConnectFormatter.formatAfterValues(KafkaConnectFormatter.java:329)
at oracle.goldengate.kafkaconnect.formatter.KafkaConnectFormatter.formatAfterValuesOp(KafkaConnectFormatter.java:278)
at oracle.goldengate.kafkaconnect.formatter.KafkaConnectFormatter.formatOp(KafkaConnectFormatter.java:212)
at oracle.goldengate.kafkaconnect.KafkaConnectHandler.formatOp(KafkaConnectHandler.java:309)
at oracle.goldengate.kafkaconnect.KafkaConnectHandler.transactionCommit(KafkaConnectHandler.java:186)
at oracle.goldengate.datasource.DsEventManager$2.send(DsEventManager.java:414)
at oracle.goldengate.datasource.DsEventManager$EventDispatcher.distributeEvent(DsEventManager.java:231)
at oracle.goldengate.datasource.DsEventManager.fireTransactionCommit(DsEventManager.java:422)
at oracle.goldengate.datasource.AbstractDataSource.fireTransactionCommit(AbstractDataSource.java:490)
at oracle.goldengate.datasource.UserExitDataSource.commitActiveTransaction(UserExitDataSource.java:1582)
at oracle.goldengate.datasource.UserExitDataSource.commitTx(UserExitDataSource.java:1525)
ERROR 2016-08-30 17:25:09,550 [main] ERROR (KafkaConnectHandler.java:312) - Confluent Kafka Handler failed to format and process operation: table=[PDB.SOE.CUSTOMERS], op pos=00000000000000008091, tx pos=00000000000000003011, op ts=2016-07-29 14:59:47.000137
java.lang.IndexOutOfBoundsException: Index: 16, Size: 16
at java.util.ArrayList.rangeCheck(ArrayList.java:653)
at java.util.ArrayList.get(ArrayList.java:429)
at oracle.goldengate.datasource.meta.TableMetaData.getColumnMetaData(TableMetaData.java:73)
Note the IndexOutOfBoundsException error.
Working around the error
I'm in the fortunate position of being in a sandbox environment in which I can modify the source schema to suit my needs - so I just dropped the function-based index. In reality this evidently would not be a good approach on the assumption that the index was there for a good reason!
DROP INDEX "SOE"."CUST_FUNC_LOWER_NAME_IX";
Having run this, we still have the question of how to get the replicat working. To do this we could go the whole-hog and drop and recreate the extracts; or, we can get the replicat to skip the section of the trail file with the records in that we can't process. Assuming you've run the above DROP and then written more data to the table, there'll be a second metadata record in the OGG trail file. We can use the FILTER command to find this:
Logdump 69 >FILTER INCLUDE FILENAME ORCL.SOE.CUSTOMERS;FILTER EXCLUDE RECTYPE 5,134;FILTER MATCH ALL
This shows records for just this table, and excludes record types 5 and 134 (INSERT and UPDATE respectively). We can then scan through the file with NEXT command and see:
Logdump 72 >n
Scanned     10000 records, RBA    2365691, 2016/09/06 12:12:16.001.191
Scanned     20000 records, RBA    4716374, 2016/09/06 14:48:54.971.161
Scanned     30000 records, RBA    7067022, 2016/09/06 14:57:34.000.170
Scanned     40000 records, RBA    9413177, 2016/09/06 15:07:41.000.186
Scanned     50000 records, RBA   11773709, 2016/09/06 15:16:07.000.594
Scanned     60000 records, RBA   14126750, 2016/09/06 15:24:38.001.063
-------------------------------------------------------------------
Hdr-Ind    :     E  (x45)     Partition  :     .  (x00)
UndoFlag   :     .  (x00)     BeforeAfter:     A  (x41)
RecLength  :  1308  (x051c)   IO Time    : 2016/09/06 17:11:21.717.818
IOType     :   170  (xaa)     OrigNode   :     2  (x02)
TransInd   :     .  (x03)     FormatType :     R  (x52)
SyskeyLen  :     0  (x00)     Incomplete :     .  (x00)
DDR/TDR Idx:   (002, 009)     AuditPos   : 9986576
Continued  :     N  (x00)     RecCount   :     1  (x01)

2016/09/06 17:11:21.717.818 Metadata             Len 1308 RBA 14702330
Name: ORCL.SOE.CUSTOMERS
*
1)Name          2)Data Type        3)External Length  4)Fetch Offset      5)Scale         6)Level
7)Null          8)Bump if Odd      9)Internal Length 10)Binary Length    11)Table Length 12)Most Sig DT
13)Least Sig DT 14)High Precision  15)Low Precision   16)Elementary Item  17)Occurs       18)Key Column
19)Sub DataType 20)Native DataType 21)Character Set   22)Character Length 23)LOB Type     24)Partial Type
*
TDR version: 1
Definition for table ORCL.SOE.CUSTOMERS
Record Length: 450
Columns: 16
CUSTOMER_ID        134     13        0  0  0 1 0      8      8      8 0 0 0 0 1    0 1   3    2       -1      0 0 0
CUST_FIRST_NAME     64     40       12  0  0 1 0     40     40      0 0 0 0 0 1    0 0   0    1       -1      0 0 0
CUST_LAST_NAME      64     40       58  0  0 1 0     40     40      0 0 0 0 0 1    0 0   0    1       -1      0 0 0
NLS_LANGUAGE        64      3      104  0  0 1 0      3      3      0 0 0 0 0 1    0 0   0    1       -1      0 0 0
NLS_TERRITORY       64     30      112  0  0 1 0     30     30      0 0 0 0 0 1    0 0   0    1       -1      0 0 0
CREDIT_LIMIT       134     11      148  2  0 1 0      8      8      8 0 0 0 0 1    0 0   3    2       -1      0 0 0
CUST_EMAIL          64    100      160  0  0 1 0    100    100      0 0 0 0 0 1    0 0   0    1       -1      0 0 0
ACCOUNT_MGR_ID     134     13      266  0  0 1 0      8      8      8 0 0 0 0 1    0 0   3    2       -1      0 0 0
CUSTOMER_SINCE     192     19      278  0  0 1 0     19     19     19 0 5 0 0 1    0 0   0   12       -1      0 0 0
CUSTOMER_CLASS      64     40      300  0  0 1 0     40     40      0 0 0 0 0 1    0 0   0    1       -1      0 0 0
SUGGESTIONS         64     40      346  0  0 1 0     40     40      0 0 0 0 0 1    0 0   0    1       -1      0 0 0
DOB                192     19      392  0  0 1 0     19     19     19 0 5 0 0 1    0 0   0   12       -1      0 0 0
MAILSHOT            64      1      414  0  0 1 0      1      1      0 0 0 0 0 1    0 0   0    1       -1      0 0 0
PARTNER_MAILSHOT    64      1      420  0  0 1 0      1      1      0 0 0 0 0 1    0 0   0    1       -1      0 0 0
PREFERRED_ADDRESS  134     13      426  0  0 1 0      8      8      8 0 0 0 0 1    0 0   3    2       -1      0 0 0
PREFERRED_CARD     134     13      438  0  0 1 0      8      8      8 0 0 0 0 1    0 0   3    2       -1      0 0 0
End of definition


Filtering suppressed  62444 records
Here's the new table metadata, for sixten columns only and minus the SYS_[...] columns. Its position as shown in the record above is RBA 14702330. To get the commit sequence number (CSN), which we can use to restart the replicat, we need to enable the display of OGG-generated data in the records (ref):
GGSTOKEN ON
GGSTOKEN DETAIL
The Metadata record itself doesn't have a CSN, so disable the filtering
FILTER OFF
and then go to the next record
Logdump 123 >FILTER OFF
Logdump 124 >N
-------------------------------------------------------------------
Hdr-Ind    :     E  (x45)     Partition  :     .  (x0c)
UndoFlag   :     .  (x00)     BeforeAfter:     A  (x41)
RecLength  :   255  (x00ff)   IO Time    : 2016/09/06 17:11:18.000.200
IOType     :     5  (x05)     OrigNode   :   255  (xff)
TransInd   :     .  (x00)     FormatType :     R  (x52)
SyskeyLen  :     0  (x00)     Incomplete :     .  (x00)
AuditRBA   :        396       AuditPos   : 9986576
Continued  :     N  (x00)     RecCount   :     1  (x01)

2016/09/06 17:11:18.000.200 Insert               Len   255 RBA 14703707
Name: ORCL.SOE.CUSTOMERS  (TDR Index: 9)
After  Image:                                             Partition 12   G  b
0000 000a 0000 0000 0000 0009 27c1 0001 000b 0000 | ............'.......
0007 6775 7374 6176 6f00 0200 0a00 0000 0663 6173 | ..gustavo........cas

[...]

GGS tokens:
TokenID x52 'R' ORAROWID         Info x00  Length   20
4141 4166 632f 4141 4141 4141 434d 6541 4162 0001 | AAAfc/AAAAAACMeAAb..
TokenID x4c 'L' LOGCSN           Info x00  Length    8
3131 3637 3235 3433                               | 11672543
TokenID x36 '6' TRANID           Info x00  Length    9
3236 2e32 372e 3139 35                            | 26.27.195
TokenID x69 'i' ORATHREADID      Info x01  Length    2
0001                                              | ..
It's an INSERT record for our table, with the LOGCSN shown as 11672543.
So if we're happy to ditch all the data in the trail file since it was set up until the point at which we 'fixed' the virtual column issue, we can run in GGSCI:
GGSCI (bigdatalite.localdomain) 44> start rkafka atcsn 0.11672543

Sending START request to MANAGER ...
REPLICAT RKAFKA starting

GGSCI (bigdatalite.localdomain) 49> info rkafka

REPLICAT   RKAFKA    Last Started 2016-09-06 17:32   Status RUNNING
Checkpoint Lag       00:00:00 (updated 00:00:09 ago)
Process ID           25860
Log Read Checkpoint  File ./dirdat/rt000000000
2016-09-06 17:11:22.000764  RBA 14724721
and over in Kafka itself we can now see the records coming through:
$ kafka-console-consumer --zookeeper localhost --topic ORCL.SOE.LOGON
ORCL.SOE.LOGONI42016-09-02 14:56:26.00041142016-09-06T15:50:52.194000(00000000000000002010LOGON_IDCUSTOMER_IDLOGON_DATE4242&2016-09-02:15:56:25
ORCL.SOE.LOGONI42016-09-05 14:39:02.00040942016-09-06T15:50:52.875000(00000000000000002437LOGON_IDCUSTOMER_IDLOGON_DATE4242&2016-09-05:15:39:00
ORCL.SOE.LOGONI42016-09-05 14:44:15.00046042016-09-06T15:50:52.877000(00000000000000002593LOGON_IDCUSTOMER_IDLOGON_DATE4242&2016-09-05:15:44:13
ORCL.SOE.LOGONI42016-09-05 14:46:16.00043642016-09-06T15:50:52.879000(00000000000000002748LOGON_IDCUSTOMER_IDLOGON_DATE4242&2016-09-05:15:46:11
ORCL.SOE.LOGONI42016-09-05 16:17:25.00014242016-09-06T15:50:52.881000(00000000000000002903LOGON_IDCUSTOMER_IDLOGON_DATE4242&2016-09-05:17:17:24
ORCL.SOE.LOGONI42016-09-05 16:22:38.00040142016-09-06T15:50:52.883000(00000000000000003058LOGON_IDCUSTOMER_IDLOGON_DATE4242&2016-09-05:17:22:37
ORCL.SOE.LOGONI42016-09-05 16:25:16.00015142016-09-06T15:50:52.885000(00000000000000003215LOGON_IDCUSTOMER_IDLOGON_DATE4242&2016-09-05:17:25:16
ORCL.SOE.LOGONI42016-09-05 16:26:25.00017542016-09-06T15:50:52.886000(00000000000000003372LOGON_IDCUSTOMER_IDLOGON_DATE4242&2016-09-05:17:26:25
ORCL.SOE.LOGONI42016-09-05 16:27:20.00018642016-09-06T15:50:52.888000(00000000000000003527LOGON_IDCUSTOMER_IDLOGON_DATE4242&2016-09-05:17:27:19
A Better Workaround?
Per Handling Other Database Properties, virtual columns can be handled by using the TABLE FETCHCOLS configuration on the extract to read the virtual values and MAP of the replicat to map them to actual columns on the target. Unfortunately, the system-generated column name isn't accepted by OGG in the FETCHCOLS syntax:
INFO    OGG-06507  Oracle GoldenGate Capture for Oracle, ext1.prm:  MAP (TABLE) resolved (entry ORCL.SOE.CUSTOMERS): TABLE "ORCL"."SOE"."CUSTOMERS", FETCHCOLS(SYS_NC00017$).
ERROR   OGG-00366  Oracle GoldenGate Capture for Oracle, ext1.prm:  Invalid column specified in FETCHCOLS/FETCHCOLSEXCEPT: SYS_NC00017$.
ERROR   OGG-01668  Oracle GoldenGate Capture for Oracle, ext1.prm:  PROCESS ABENDING.
Another tack to try, given that in our case we simply want to make sure the virtual columns don't get picked up at all - is to try and ignore the column altogether. Unfortunately from my experimentation with COLSEXCEPT it appears that OGG excludes specified columns from record data, but not the initial metadata (which is what causes the above problems in the first place). Even if this had worked, COLSEXCEPT doesn't like the system-generated column name, abending the Extract process with:
INFO    OGG-06507  Oracle GoldenGate Capture for Oracle, ext1.prm:  MAP (TABLE) resolved (entry ORCL.SOE.CUSTOMERS): TABLE "ORCL"."SOE"."CUSTOMERS", COLSEXCEPT(SYS_NC00017$).
ERROR   OGG-00366  Oracle GoldenGate Capture for Oracle, ext1.prm:  Invalid column specified in COLS/COLSEXCEPT: SYS_NC00017$.
ERROR   OGG-01668  Oracle GoldenGate Capture for Oracle, ext1.prm:  PROCESS ABENDING.
Conclusion
Oracle GoldenGate is a fantastic way to stream changes from many different RDBMS to a variety of targets, including Kafka. The potential that this offers in terms of data integration and pipelines is great. This post has hopefully shed a little bit of light on how to go about troubleshooting issues that can occur when using this set of tools. Do let me know in the comments below if you have better suggestions for how to deal with the virtual columns created as a result of the function-based index!
Rittman Mead at Collaborate 16: Data Integration Focus
It’s that time of year again when Oracle technologists from around the world gather in Las Vegas, NV to teach, learn, and, of course, network with their peers. The Collaborate conference, running for 10 years now, has been a collaboration, if you will, between the Independent Oracle Users Group (IOUG), Oracle Applications Users Group (OAUG) and Quest International Users Group (Quest), making it one of the largest user group conferences in the world. Rittman Mead will once again be in attendance, with two data integration focused presentations by me over the course of the week.
My first session, “A Walk Through the Kimball ETL Subsystems with Oracle Data Integration”, scheduled for Monday, April 11 at 10:30am, will focus on how we can implement the ETL Subsystems using Oracle Data Integration solutions. As you know, Big Data integration has been the hot topic over the past few years, and it’s an excellent feature in the Oracle Data Integration product suite (Oracle Data Integrator, GoldenGate, & Enterprise Data Quality). But not all analytics require big data technologies, such as labor cost, revenue, or expense reporting. Ralph Kimball, dimensional modeling and data warehousing expert and founder of The Kimball Group, spent much of his career working to build an enterprise data warehouse methodology that can meet these reporting needs. His book, “The Data Warehouse ETL Toolkit“, is a guide for many ETL developers. This session will walk you through his ETL Subsystem categories; Extracting, Cleaning & Conforming, Delivering, and Managing, describing how the Oracle Data Integration products are perfectly suited for the Kimball approach.
I go into further detail on one of the ETL Subsystems in an upcoming IOUG Select Journal article, titled “Implement an Error Event Schema with Oracle Data Integrator”. The Select Journal is a technical magazine published quarterly and available exclusively to IOUG members. My recent post Data Integration Tips: ODI 12c Repository Query – Find the Mapping Target Table shows a bit of the detail behind the research performed for the article.

If you’re not familiar with the Kimball approach to data warehousing, I definitely would recommend reading one (or more) of their published books on the subject. I would also recommend attending one of their training courses, but unfortunately for the data warehousing community the Kimball Group has closed shop as of December 2015. But hey, the good news is that two of the former Kimball team members have joined forces at Decision Works, and they offer the exact same training they used to deliver under The Kimball Group name.

On Thursday, April 14 at 11am, I will dive into the recently released Oracle GoldenGate for Big Data 12.2 in a session titled “Oracle GoldenGate and Apache Kafka: A Deep Dive into Real-Time Data Streaming”. The challenge for us as data integration professionals is to combine relational data with other non-structured, high volume and rapidly changing datasets, known in the industry as Big Data, and transform it into something useful. Not just that, but we must also do it in near real-time and using a big data target system such as Hadoop. The topic of this session, real-time data streaming, provides us a great solution for that challenging task. By combining GoldenGate, Oracle’s premier data replication technology, and Apache Kafka, the latest open-source streaming and messaging system for big data, we can implement a fast, durable, and scalable solution.
If you plan to be at Collaborate next week, feel free to drop me a line in the comments, via email at michael.rainey@rittmanmead.com, or on Twitter @mRainey, I’d love to meet up and have a discussion around my presentation topics, data integration, or really anything we’re doing at Rittman Mead. Hope to see you all there!
The post Rittman Mead at Collaborate 16: Data Integration Focus appeared first on Rittman Mead Consulting.
Kickstart Your 2016 with Rittman Mead’s Data Integration Training
Happy Holidays and a Happy New Year to all! As you begin your 2016 this January, it’s time to start planning your team’s data integration training. Look no further than Rittman Mead’s Oracle Data Integrator training course! We offer a 4 day Oracle Data Integrator 12c Bootcamp for those looking to take advantage of the latest and greatest features in ODI 12c. We also still teach our 5 day Oracle Data Integrator 11g Bootcamp, as we know sometimes it can be difficult to upgrade to the latest release and new data warehouse team members need to be brought up to speed on the product. ODI 11g is also still very much alive in Oracle Business Intelligence Applications, being the ETL technology for the 11g release of the product suite.

Customized Data Integration Training
BI Apps 11g training has been a hot topic from the data integration perspective over the last couple of years. Rittman Mead have delivered custom BI Apps training for ODI developers several times just within the last year, prompting us to add a new public training course specific to this topic to our public schedule. This course walks attendees through the unique relationship between OBIEE and ODI 11g as the data integration technology, including configuration, load plan generation, and ETL customization. If you have an Oracle Business Intelligence Applications 11g team looking to enhance their ODI 11g skills, take a look at the new ODI for BI Applications course description.
The customization of training does not just apply to BI Applications, but to all aspects of Oracle Data Integration. Whether adding more details around Oracle GoldenGate installation and maintenance to the ODI 12c course, or learning about Oracle EDQ integration, the Rittman Mead data integration team of experts can work to deliver the course so your team gains the most value from its investment in Oracle Data Integration technologies. Just ask! Reach out and we can work together to create a custom course to fit your needs.
Public or Onsite Training?
Rittman Mead has several dates for each course, scheduled to be delivered out of our offices in either Atlanta, GA or Brighton, UK. Take a look here for our ODI 12c bootcamp, ODI 11g bootcamp, and ODI for BI Apps Developers offerings in the US. Look here for the same in the UK/Europe (Note: as of the writing of this blog post, the 2016 UK/Europe schedule had not been released). We also offer the same courses for delivery onsite at your company’s office, allowing our experts to come to you! Quite often our clients will combine consulting and training, ensuring they get the most out of their investment in our team of experts.
Why Rittman Mead?
Many folks in the Business Intelligence and Data Integration profession who are looking for a consulting company might think Rittman Mead only work on extremely challenging projects based on the depth of knowledge and type of problems (and solutions) we offer via our blog. The fact is, most of our projects are the “standard” data warehouse or business intelligence reporting implementations, with some of these additional challenges coming along the way. Why do I bring that up? Well, if you’re looking for the experts in Oracle Data Integration technology, with experience in both project implementation and solving challenging technical problems, then you’ve come to the right place to learn about ODI.
Unlike many other companies offering training, we don’t have a staff of educators on hand. Our trainers are the same folks that deliver projects, using the technology you’re interested in learning about, on a day-to-day basis. We offer you real world examples as we walk through our training slide deck and labs. Need to know why Oracle GoldenGate is an integral part of real-time data integration? Let me tell you about my latest client where I implemented GoldenGate and ODI. Want to know what to look out for when installing the JEE Agent in ODI 12c? We’ve done that many times – and know the tricks necessary to get it all working.
Our experts, such Jérôme Françoisse, Becky Wagner, Mark Rittman, myself, and many others, all have multiple years of experience with Oracle Data Integration implementations. Not only that, but we here at Rittman Mead truly enjoy sharing our knowledge! Whether posting to this blog, speaking at Oracle conferences, or on the OTN forums, Rittman Mead experts are always looking to teach others in order to better the Oracle Data Integration community.
If you or your company are in need of Oracle Data Integration training, please drop us a line at training@rittmanmead.com. As always, feel free to reach out to me directly on Twitter (@mRainey), LinkedIn, or via email (michael.rainey@rittmanmead.com) if you have any direct questions. See you all next year!
The post Kickstart Your 2016 with Rittman Mead’s Data Integration Training appeared first on Rittman Mead Consulting.
Oracle GoldenGate, MySQL and Flume
Back in September Mark blogged about Oracle GoldenGate (OGG) and HDFS . In this short followup post I’m going to look at configuring the OGG Big Data Adapter for Flume, to trickle feed blog posts and comments from our site to HDFS. If you haven’t done so already, I strongly recommend you read through Mark’s previous post, as it explains in detail how the OGG BD Adapter works. Just like Hive and HDFS, Flume isn’t a fully-supported target so we will use Oracle GoldenGate for Java Adapter user exits to achieve what we want.
What we need to do now is
- Configure our MySQL database to be fit for duty for GoldenGate.
- Install and configure Oracle GoldenGate for MySQL on our DB server
- Create a new OGG Extract and Trail files for the database tables we want to feed to Flume
- Configure a Flume Agent on our Cloudera cluster to ‘sink’ to HDFS
- Create and configure the OGG Java adapter for Flume
- Create External Tables in Hive to expose the HDFS files to SQL access

Setting up the MySQL Database Source Capture
The MySQL database I will use for this example contains blog posts, comments etc from our website. We now want to use Oracle GoldenGate to capture new blog post and our readers’ comments and feed this information in to the Hadoop cluster we have running in the Rittman Mead Labs, along with other feeds, such as Twitter and activity logs.
The database has to be configured to user binary logging and also we need to ensure that the socket file can be found in /tmp/mysql.socket. You can find the details for this in the documentation. Also we need to make sure that the tables we want to extract from are using the InnoDB engine and not the default MyISAM one. The engine can easily be changed by issuing
alter table wp_mysql.wp_posts engine=InnoDB;
Assuming we already have installed OGG for MySQL on /opt/oracle/OGG/ we can now go ahead and configure the Manager process and the Extract for our tables. The tables we are interested in are
wp_mysql.wp_posts
wp_mysql.wp_comments
wp_mysql.wp_users
wp_mysql.wp_terms
wp_mysql.wp_term_taxonomy
First configure the manager
-bash-4.1$ cat dirprm/mgr.prm
PORT 7809
PURGEOLDEXTRACTS /opt/oracle/OGG/dirdat/*, USECHECKPOINTS
Now configure the Extract to capture changes made to the tables we are interested in
-bash-4.1$ cat dirprm/mysql.prm
EXTRACT mysql
SOURCEDB wp_mysql, USERID root, PASSWORD password
discardfile /opt/oracle/OGG/dirrpt/FLUME.dsc, purge
EXTTRAIL /opt/oracle/OGG/dirdat/et
GETUPDATEBEFORES
TRANLOGOPTIONS ALTLOGDEST /var/lib/mysql/localhost-bin.index
TABLE wp_mysql.wp_comments;
TABLE wp_mysql.wp_posts;
TABLE wp_mysql.wp_users;
TABLE wp_mysql.wp_terms;
TABLE wp_mysql.wp_term_taxonomy;
We should now be able to create the extract and start the process, as with a normal extract.
ggsci>add extract mysql, tranlog, begin now
ggsci>add exttrail ./dirdat/et, extract mysql
ggsci>start extract mysql
ggsci>info mysql
ggsci>view report mysql
We will also have to generate metadata to describe the table structures in the MySQL database. This file will be used by the Flume adapter to map columns and data types to the Avro format.
-bash-4.1$ cat dirprm/defgen.prm
-- To generate trail source-definitions for GG v11.2 Adapters, use GG 11.2 defgen,
-- or use GG 12.1.x defgen with "format 11.2" definition format.
-- If using GG 12.1.x as a source for GG 11.2 adapters, also generate format 11.2 trails.

-- UserId logger, Password password
SOURCEDB wp_mysql, USERID root, PASSWORD password

DefsFile dirdef/wp.def

TABLE wp_mysql.wp_comments;
TABLE wp_mysql.wp_posts;
TABLE wp_mysql.wp_users;
TABLE wp_mysql.wp_terms;
TABLE wp_mysql.wp_term_taxonomy;
-bash-4.1$ ./defgen PARAMFILE dirprm/defgen.prm

***********************************************************************
        Oracle GoldenGate Table Definition Generator for MySQL
      Version 12.1.2.1.0 OGGCORE_12.1.2.1.0_PLATFORMS_140920.0203
...

***********************************************************************
**            Running with the following parameters                  **
***********************************************************************
SOURCEDB wp_mysql, USERID root, PASSWORD ******
DefsFile dirdef/wp.def
TABLE wp_mysql.wp_comments;
Retrieving definition for wp_mysql.wp_comments.
TABLE wp_mysql.wp_posts;
Retrieving definition for wp_mysql.wp_posts.
TABLE wp_mysql.wp_users;
Retrieving definition for wp_mysql.wp_users.
TABLE wp_mysql.wp_terms;
Retrieving definition for wp_mysql.wp_terms.
TABLE wp_mysql.wp_term_taxonomy;
Retrieving definition for wp_mysql.wp_term_taxonomy.


Definitions generated for 5 tables in dirdef/wp.def.
Setting up the OGG Java Adapter for Flume
The OGG Java Adapter for Flume will use the EXTTRAIL created earlier as a source, pack the data up and feed to the cluster Flume Agent, using Avro and RPC. The Flume Adapter thus needs to know
- Where is the OGG EXTTRAIL to read from
- How to treat the incoming data and operations (e.g. Insert, Update, Delete)
- Where to send the Avro messages to
First we create a parameter file for the Flume Adapter
-bash-4.1$ cat dirprm/flume.prm
EXTRACT flume
SETENV ( GGS_USEREXIT_CONF = "dirprm/flume.props")
CUSEREXIT libggjava_ue.so CUSEREXIT PASSTHRU INCLUDEUPDATEBEFORES
GETUPDATEBEFORES
NOCOMPRESSUPDATES
SOURCEDEFS ./dirdef/wp.def
DISCARDFILE ./dirrpt/flume.dsc, purge

TABLE wp_mysql.wp_comments;
TABLE wp_mysql.wp_posts;
TABLE wp_mysql.wp_users;
TABLE wp_mysql.wp_terms;
TABLE wp_mysql.wp_term_taxonomy;
There are two things to note here
- The OGG Java Adapter User Exit is configured in a file called flume.props
- The source tables’ structures are defined in wp.def
The flume.props file is a ‘standard’ User Exit config file
-bash-4.1$ cat dirprm/flume.props
gg.handlerlist=ggflume

gg.handler.ggflume.type=com.goldengate.delivery.handler.flume.FlumeHandler
gg.handler.ggflume.host=bd5node1.rittmandev.com
gg.handler.ggflume.port=4545

gg.handler.ggflume.rpcType=avro
gg.handler.ggflume.delimiter=;
gg.handler.ggflume.mode=tx
gg.handler.ggflume.includeOpType=true
# Indicates if the operation timestamp should be included as part of output in the delimited separated values
# true - Operation timestamp will be included in the output
# false - Operation timestamp will not be included in the output
# Default :- true
gg.handler.ggflume.includeOpTimestamp=true

# Optional properties to use the transaction grouping functionality
#gg.handler.ggflume.maxGroupSize=1000
#gg.handler.ggflume.minGroupSize=1000

### native library config ###
goldengate.userexit.nochkpt=TRUE
goldengate.userexit.timestamp=utc
goldengate.log.logname=cuserexit
goldengate.log.level=INFO
goldengate.log.tofile=true
goldengate.userexit.writers=javawriter

gg.report.time=30sec
gg.classpath=AdapterExamples/big-data/flume/target/flume-lib/*

javawriter.stats.full=TRUE
javawriter.stats.display=TRUE
javawriter.bootoptions=-Xmx32m -Xms32m -Djava.class.path=ggjava/ggjava.jar -Dlog4j.configuration=log4j.properties
Some points of interest here are
- The Flume agent we will send our data to is running on port 4545 on host bd5node1.rittmandev.com
- We want each record to be prefixed with I(nsert), U(pdated) or D(delete)
- We want each record to be postfixed with a timestamp of the transaction date
- The Java class com.goldengate.delivery.handler.flume.FlumeHandler will do the actual work. (The curios reader can view the code in /opt/oracle/OGG/AdapterExamples/big-data/flume/src/main/java/com/goldengate/delivery/handler/flume/FlumeHandler.java)
Before starting up the OGG Flume, let’s first make sure that the Flume agent on bd5node1 is configure to receive our Avro message (Source) and also what to do with the data (Sink)
a1.channels = c1
a1.sources = r1
a1.sinks = k2
a1.channels.c1.type = memory
a1.sources.r1.channels = c1
a1.sources.r1.type = avro
a1.sources.r1.bind = bda5node1
a1.sources.r1.port = 4545
a1.sinks.k2.type = hdfs
a1.sinks.k2.channel = c1
a1.sinks.k2.hdfs.path = /user/flume/gg/%{SCHEMA_NAME}/%{TABLE_NAME}
a1.sinks.k2.hdfs.filePrefix = %{TABLE_NAME}_
a1.sinks.k2.hdfs.writeFormat=Writable
a1.sinks.k2.hdfs.rollInterval=0
a1.sinks.k2.hdfs.hdfs.rollSize=1048576
a1.sinks.k2.hdfs.rollCount=0
a1.sinks.k2.hdfs.batchSize=100
a1.sinks.k2.hdfs.fileType=DataStream
Here we note that
- The agent’s source (inbound data stream) is to run on port 4545 and to use avro
- The agent’s sink will write to HDFS and store the files in /user/flume/gg/%{SCHEMA_NAME}/%{TABLE_NAME}
- The HDFS files will be rolled over every 1Mb (1048576 bytes)
We are now ready to head back to the webserver that runs the MySQL database and start the Flume extract, that will feed all committed MySQL transactions against our selected tables to the Flume Agent on the cluster, which in turn will write the data to HDFS
-bash-4.1$ export LD_LIBRARY_PATH=/usr/lib/jvm/jdk1.7.0_55/jre/lib/amd64/server
-bash-4.1$ export JAVA_HOME=/usr/lib/jvm/jdk1.7.0_55/
-bash-4.1$ ./ggsci
ggsci>add extract flume, exttrailsource ./dirdat/et
ggsci>start flume
ggsci>info flume
EXTRACT    FLUME     Last Started 2015-03-29 17:51   Status RUNNING
Checkpoint Lag       00:00:00 (updated 00:00:06 ago)
Process ID           24331
Log Read Checkpoint  File /opt/oracle/OGG/dirdat/et000008
                     2015-03-29 17:51:45.000000  RBA 7742
If I now submit this blogpost I should see the results showing up our Hadoop cluster in the Rittman Mead Labs.
[oracle@bda5node1 ~]$ hadoop fs -ls /user/flume/gg/wp_mysql/wp_posts
-rw-r--r--   3 flume  flume   3030 2015-03-30 16:40 /user/flume/gg/wp_mysql/wp_posts/wp_posts_.1427729981456
We can quickly create an externally organized table in Hive to view the results with SQL
hive> CREATE EXTERNAL TABLE wp_posts(
     op string,
 ID                     int,
 post_author            int,
 post_date              String,
 post_date_gmt          String,
 post_content           String,
 post_title             String,
 post_excerpt           String,
 post_status            String,
 comment_status         String,
 ping_status            String,
 post_password          String,
 post_name              String,
 to_ping                String,
 pinged                 String,
 post_modified          String,
 post_modified_gmt      String,
 post_content_filtered  String,
 post_parent            int,
 guid                   String,
 menu_order             int,
 post_type              String,
 post_mime_type         String,
 comment_count          int,
     op_timestamp timestamp
  )
 COMMENT 'External table ontop of GG Flume sink, landed in hdfs'
 ROW FORMAT DELIMITED FIELDS TERMINATED BY ';'
 STORED AS TEXTFILE
 LOCATION '/user/flume/gg/wp_mysql/wp_posts/';

hive> select post_title from gg_flume.wp_posts where op='I' and id=22112;
Total jobs = 1
Launching Job 1 out of 1
Number of reduce tasks is set to 0 since there's no reduce operator
Starting Job = job_1427647277272_0017, Tracking URL = http://bda5node1.rittmandev.com:8088/proxy/application_1427647277272_0017/
Kill Command = /opt/cloudera/parcels/CDH-5.3.0-1.cdh5.3.0.p0.30/lib/hadoop/bin/hadoop job  -kill job_1427647277272_0017
Hadoop job information for Stage-1: number of mappers: 2; number of reducers: 0
2015-03-30 16:51:17,715 Stage-1 map = 0%,  reduce = 0%
2015-03-30 16:51:32,363 Stage-1 map = 50%,  reduce = 0%, Cumulative CPU 1.88 sec
2015-03-30 16:51:33,422 Stage-1 map = 100%,  reduce = 0%, Cumulative CPU 3.38 sec
MapReduce Total cumulative CPU time: 3 seconds 380 msec
Ended Job = job_1427647277272_0017
MapReduce Jobs Launched:
Stage-Stage-1: Map: 2   Cumulative CPU: 3.38 sec   HDFS Read: 3207 HDFS Write: 35 SUCCESS
Total MapReduce CPU Time Spent: 3 seconds 380 msec
OK
Oracle GoldenGate, MySQL and Flume
Time taken: 55.613 seconds, Fetched: 1 row(s)
Please leave a comment and you’ll be contributing to an OGG Flume!

