In the last two blogs Getting Started (Part 1) and Stepping back a bit (Part 1.1) I looked at what data I could source from the boat's instrumentation and introduced some new hardware to the boat to support the analysis.
Just to recap I am looking to create the yachts Polars with a view to improving our knowledge of her abilities (whether we can use this to improve our race performance is another matter).
Polars give us a plot of the boat's speed given a true wind speed and angle. This, in turn, informs us of the optimal speed the boat could achieve at any particular angle to wind and wind speed.

In the first blog I wrote a reader in Python that takes messages from a TCP/IP feed and writes the data to a file. The reader is able, using a hash key to validate each message (See Getting Started (Part 1)). I'm also converting valid messages into a JSON format so that I can push meaningful structured data downstream. In this blog, I'll cover the architecture and considerations around the setup of Kafka for this use case. I will not cover the installation of each component, there has been a lot written in this area. (We have some internal IP to help with configuration). I discuss the process I went through to get the data in real time displayed in a Grafana dashboard.
Introducing Kafka
I have introduced Kafka into the architecture as a next step.
Why Kafka?
I would like to be able to stream this data real time and don't want to build my own batch mechanism or create a publish/ subscribe model. With Kafka I don't need to check that messages have been successfully received and if there is a failure while consuming messages the consumers will keep track of what has been consumed. If a consumer fails it can be restarted and it will pick up where it left off (consumer offset stored in Kafka as a topic). In the future, I could scale out the platform and introduce some resilience through clustering and replication (this shouldn't be required for a while). Kafka therefore is saving me a lot of manual engineering and will support future growth (should I come into money and am able to afford more sensors for the boat).
High level architecture
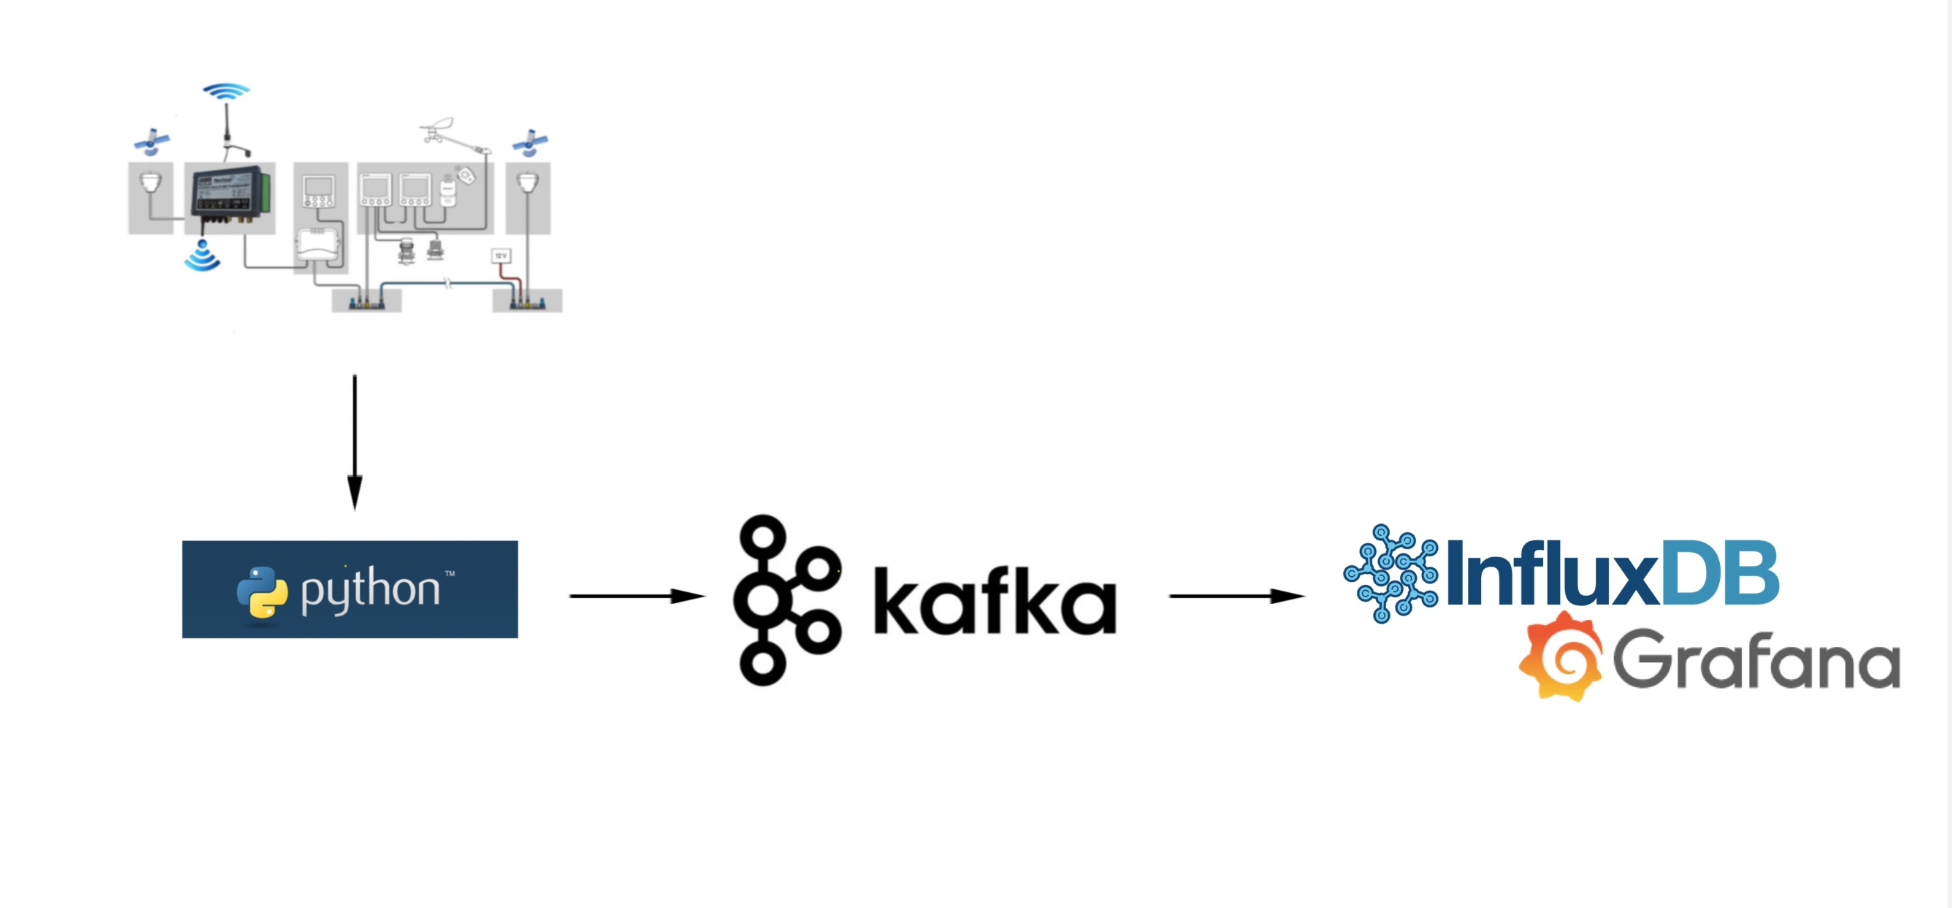
Let's look at the high-level components and how they fit together. Firstly I have the instruments transmitting on wireless TCP/IP and these messages are read using my Python I wrote earlier in the year.
I have enhanced the Python I wrote to read and translate the messages and instead of writing to a file I stream the JSON messages to a topic in Kafka.
Once the messages are in Kafka I use Kafka Connect to stream the data into InfluxDB. The messages are written to topic-specific measurements (tables in InfluxdDB).
Grafana is used to display incoming messages in real time.
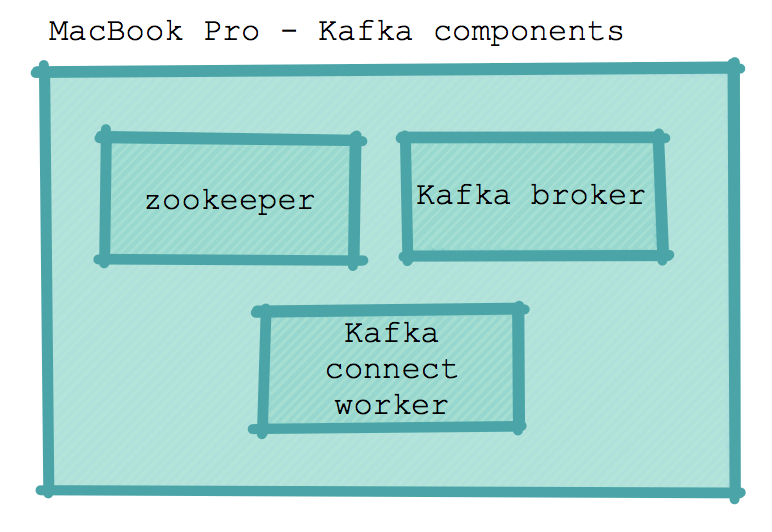
Kafka components
I am running the application on a MacBook Pro. Basically a single node instance with zookeeper, Kafka broker and a Kafka connect worker. This is the minimum setup with very little resilience.
In summary
ZooKeeper is an open-source server that enables distributed coordination of configuration information. In the Kafka architecture ZooKeeper stores metadata about brokers, topics, partitions and their locations.
ZooKeeper is configured in zookeeper.properties.
Kafka broker is a single Kafka server.
"The broker receives messages from producers, assigns offsets to them, and commits the messages to storage on disk. It also services consumers, responding to fetch requests for partitions and responding with the messages that have been committed to disk." 1
The broker is configured in server.properties. In this setup I have set auto.create.topics.enabled=false. Setting this to false gives me control over the environment as the name suggests it disables the auto-creation of a topic which in turn could lead to confusion.
Kafka connect worker allows us to take advantage of predefined connectors that enable the writing of messages to known external datastores from Kafka. The worker is a wrapper around a Kafka consumer. A consumer is able to read messages from a topic partition using offsets. Offsets keep track of what has been read by a particular consumer or consumer group. (Kafka connect workers can also write to Kafka from datastores but I am not using this functionality in this instance). The connect worker is configured in connect-distributed-properties. I have defined the location of the plugins in this configuration file. Connector definitions are used to determine how to write to an external data source.
Producer to InfluxDB
I use kafka-python to stream the messages into kafka. Within kafka-python there is a KafkaProducer that is intended to work in a similar way to the official java client.
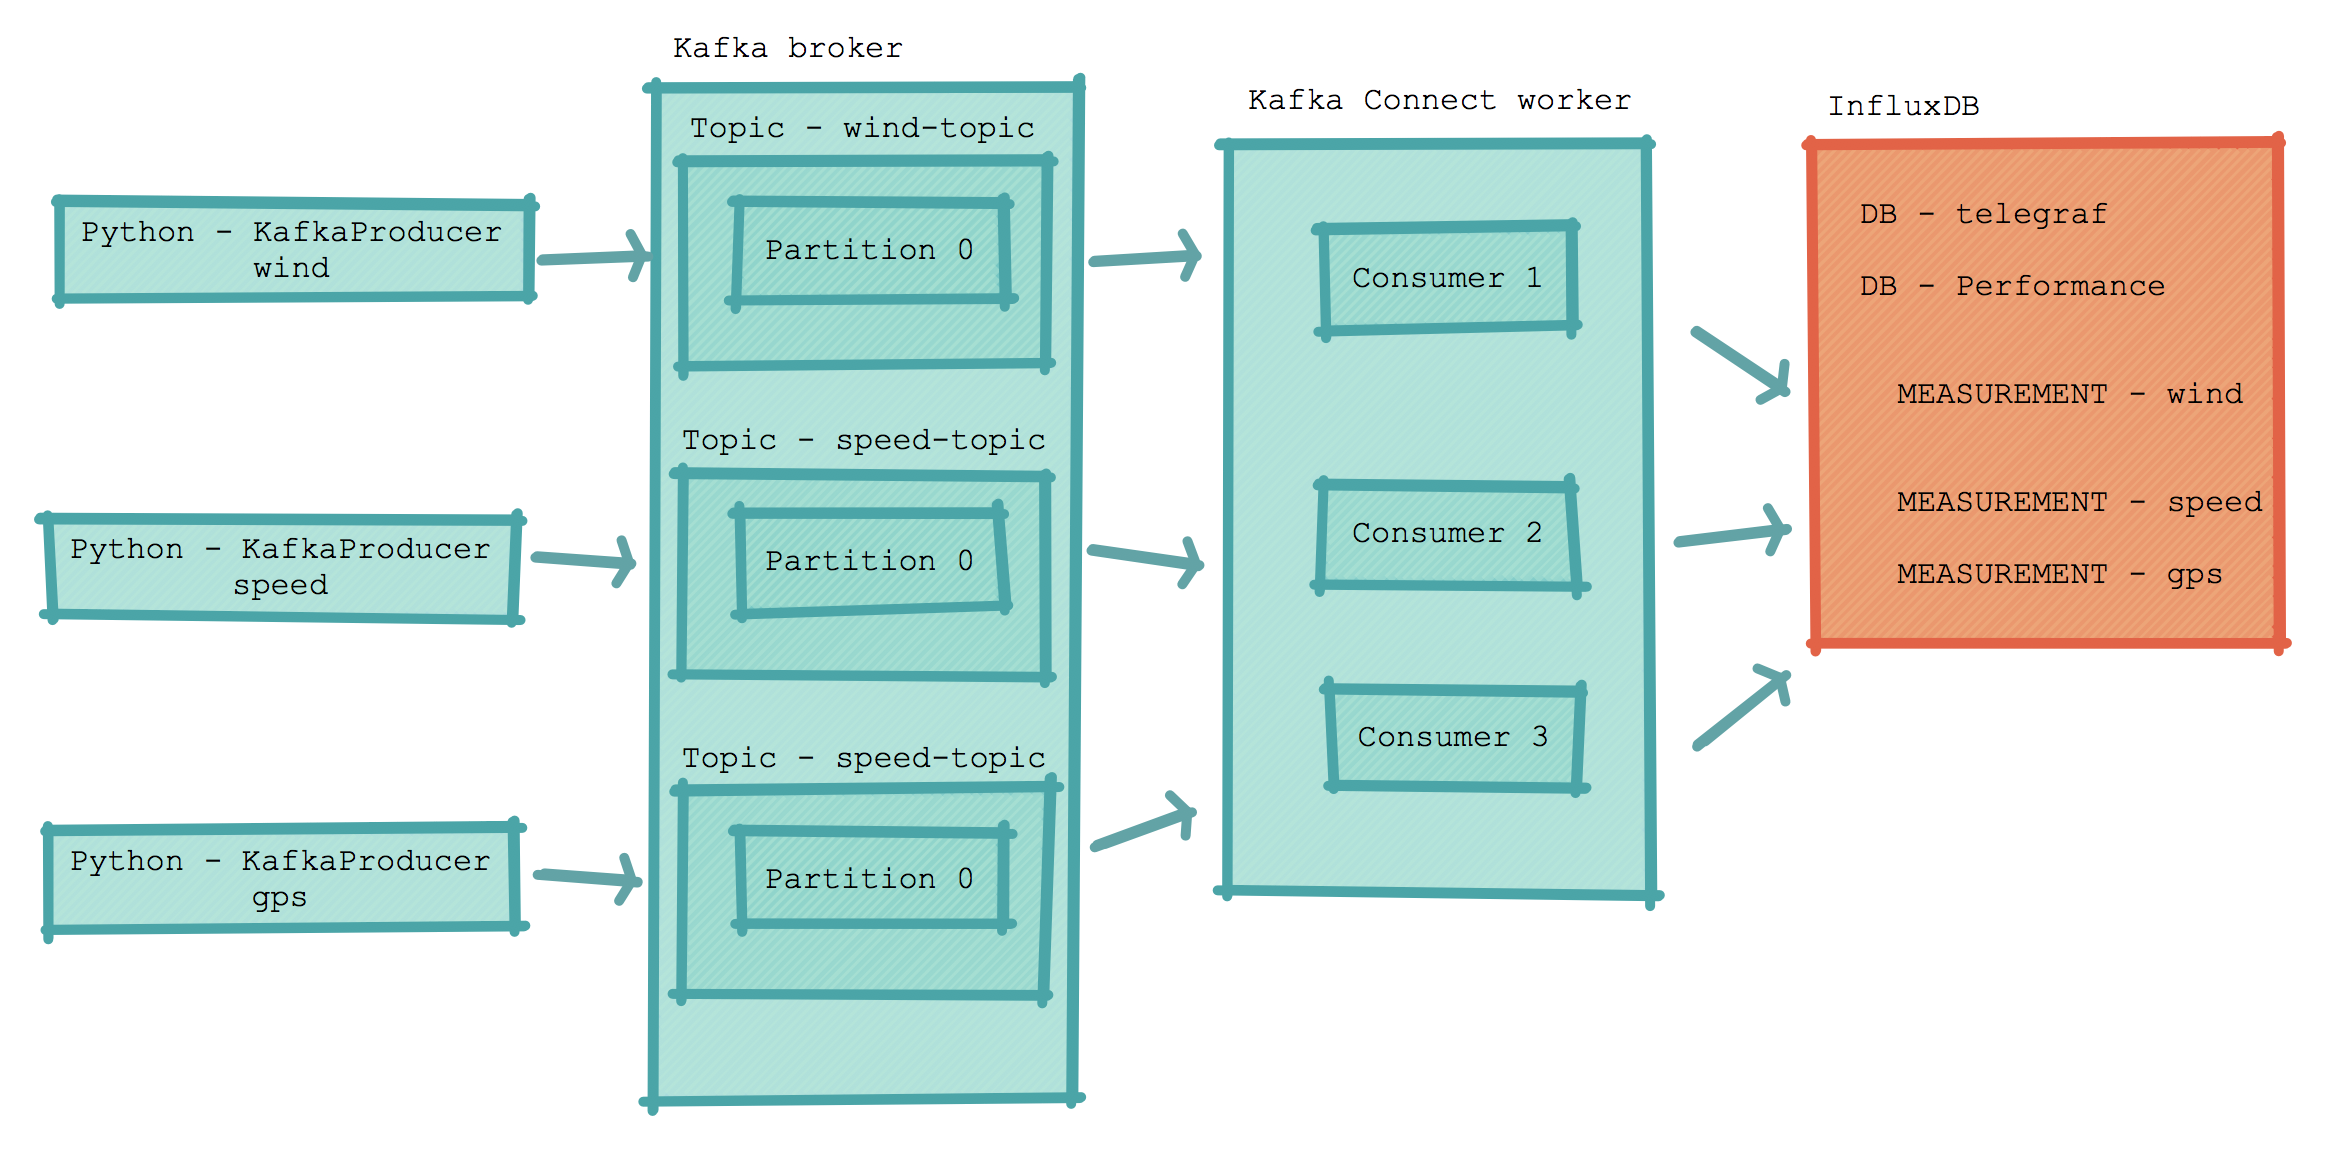
I have created a producer for each message type (parameterised code). Although each producer reads the entire stream from the TCP/IP port it only processes it's assigned message type (wind or speed) this increasing parallelism and therefore throughput.
  producer = KafkaProducer(bootstrap_servers='localhost:9092' , value_serializer=lambda v: json.dumps(v).encode('utf-8'))
  producer.send(topic, json_str)
I have created a topic per message type with a single partition. Using a single partition per topic guarantees I will consume messages in the order they arrive. There are other ways to increase the number of partitions and still maintain the read order but for this use case a topic per message type seemed to make sense. I basically have optimised throughput (well enough for the number of messages I am trying to process).
kafka-topics --create --zookeeper localhost:2181 --replication-factor 1 --partitions 1 --topic wind-json

kafka-topics --create --zookeeper localhost:2181 --replication-factor 1 --partitions 1 --topic speed-json

kafka-topics --create --zookeeper localhost:2181 --replication-factor 1 --partitions 1 --topic gps-json
When defining a topic you specify the replaication-factor and the number of partitions.
The topic-level configuration is replication.factor. At the broker level, you control the default.replication.factor for automatically created topics. 1 (I have turned off the automatic creation of topics).
The messages are consumed using Stream reactor which has an InfluxDB sink mechanism and writes directly to the measurements within a performance database I have created. The following parameters showing the topics and inset mechanism are configured in performance.influxdb-sink.properties.
topics=wind-json,speed-json,gps-json

connect.influx.kcql=INSERT INTO wind SELECT * FROM wind-json WITHTIMESTAMP sys_time();INSERT INTO speed SELECT * FROM speed-json WITHTIMESTAMP sys_time();INSERT INTO gps SELECT * FROM gps-json WITHTIMESTAMP sys_time()
The following diagram shows the detail from producer to InfluxDB.
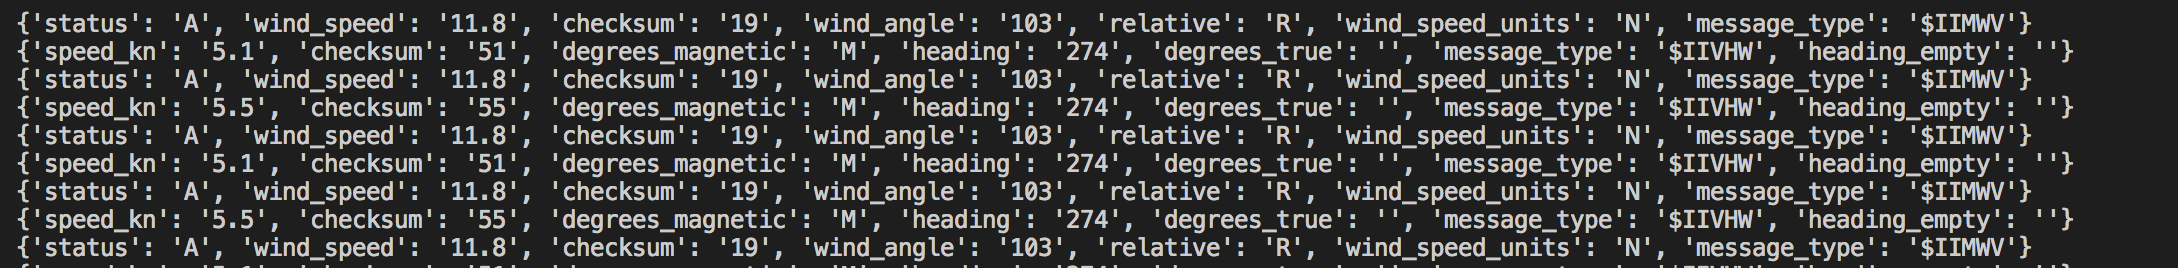
If we now run the producers we get data streaming through the platform.
Producer Python log showing JSON formatted messages:
Status of consumers show minor lag reading from two topics, the describe also shows the current offsets for each consumer task and partitions being consumed (if we had a cluster it would show multiple hosts):

Inspecting the InfluxDB measurements:
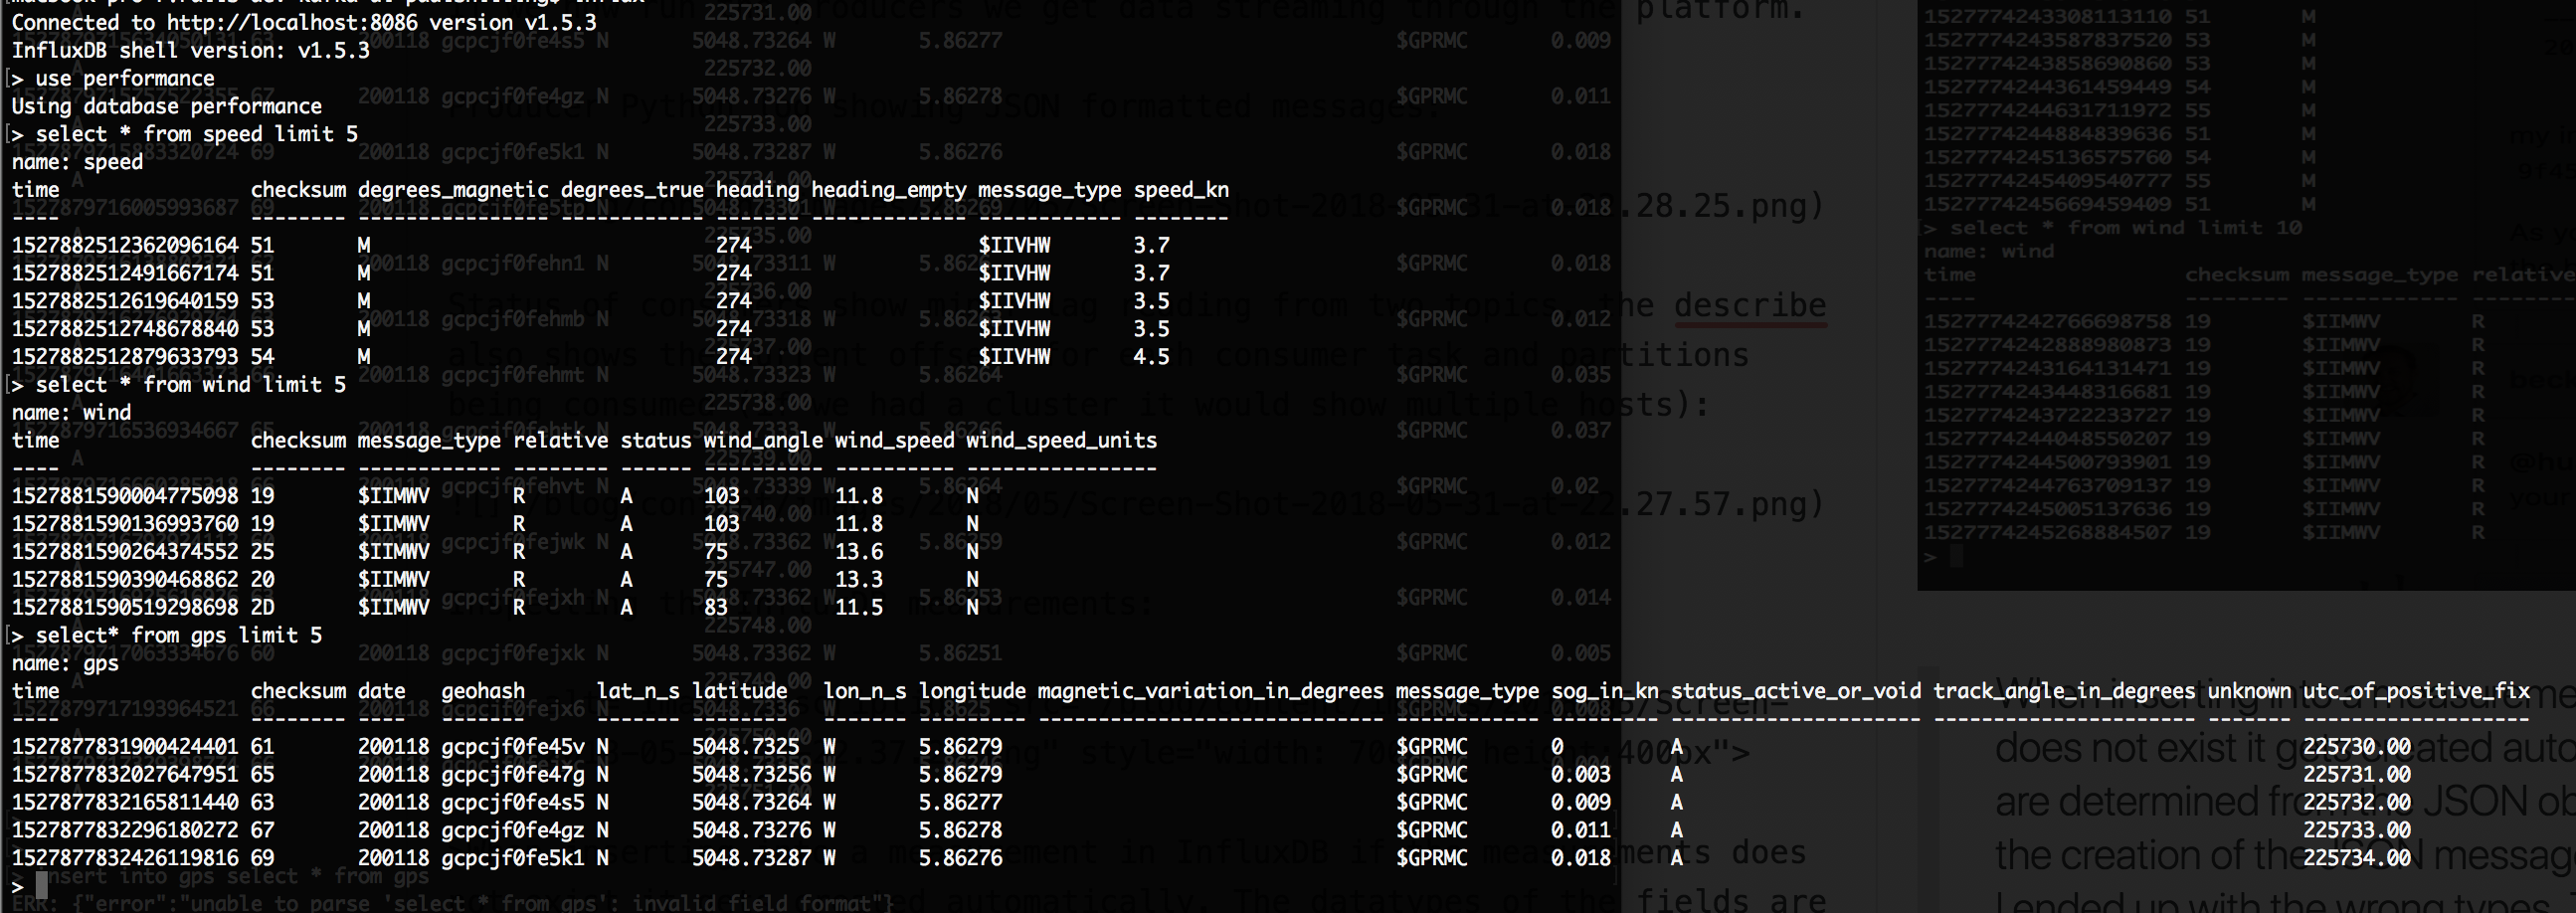
When inserting into a measurement in InfluxDB if the measurement does not exist it gets created automatically. The datatypes of the fields are determined from the JSON object being inserted. I needed to adjust the creation of the JSON message to cast the values to floats otherwise I ended up with the wrong types. This caused reporting issues in Grafana. This would be a good case for using Avro and Schema Registry to handle these definitions.
The following gif shows Grafana displaying some of the wind and speed measurements using a D3 Gauge plugin with the producers running to the right of the dials.
Next Steps
I'm now ready to do some real-life testing on our next sailing passage.
In the next blog, I will look at making the setup more resilient to failure and how to monitor and automatically recover from some of these failures. I will also introduce the WorldMap pannel to Grafana so I can plot the location the readings were taken and overlay tidal data.
References